Curated OER
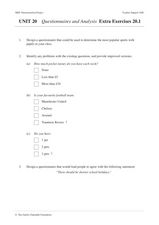
Unit 20 Questionnaires and Analysis Extra Exercises 20.1
In this statistics instructional activity, students design a biased questionnaire. They create data displays based on given statistics. There are a total of 9 problems.
Curated OER
Nine Examples for Tables, Pictographs, Mean. Median, and Mode
In this graphical representation of data and measures of central tendency worksheet, students calculate mean, median, and mode and answer questions related to graphs, tables, and pictographs.
Curated OER
Would You Rather Have a Pet With Fur, Fins, Or Feathers? --Class Bar Graph
In this math activity, learners participate in a group graphing activity. Students are surveyed about favorite types of pets: with fur, feathers or fins. Results are plotted on this class graph.
Curated OER
Data Handling
In this data handling worksheet, 6th graders solve and complete 4 various types of problems. First, they draw a bar chart to represent the information provided in the table shown. Then, students show beneath the table how to work out the...
Curated OER
Data Handling
In this data handling instructional activity, learners explore multiple ways to represent data. They create stem and leaf plots, histograms, and bar charts. Students examine and interpret diagrams and statistics. This eleven-page...
Curated OER
Third Grade Math
For this math review worksheet, 3rd graders answer multiple choice questions about probability, bar graphs, pictographs, and more. Students complete 25 multiple choice questions.
Curated OER
Recording Data From a Survey Reteaching Worksheet
In this recording data from a surveys reteaching worksheet, 2nd graders review the use of tallies when recording data. They use the information to make a data table and a bar graph that displays the information.
Curated OER
Magnetic Storms
In this magnetic storms and Earth's magnetic field worksheet, students use a bar graph showing the Kp Index for planetary variability. Students use the bar graph to answer 3 questions about the solar storms and their Kp values.
Curated OER
An Inventory of My Traits
In this biology activity, students identify and describe a number of easily observable genetic traits and compare the traits they have with other students. Then they identify and describe that some traits are common while others are not...
Curated OER
TV Survey - Data Collection and Analysis
In this data collection and analysis worksheet, 4th graders complete a tally chart about the number of hours that fourth graders watch television. They create a bar graph with the information, write a paragraph about the survey results,...
Curated OER
Pictures of Data: Post Test
In this data worksheet, students answer multiple choice questions about charts and graphs. Students answer 10 questions total.
Curated OER
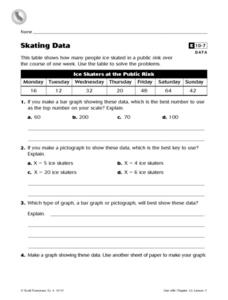
Skating Data
In this collecting data worksheet, 4th graders view a table on ice skaters at a public rink in order to answer 2 multiple choice questions, 1 short answer question and make a graph showing one piece of the data.
Curated OER
Where Did We Go on Holiday This Year?
For this differentiated whole-group activity worksheet, students list all the places they visited over the summer, record the places on a flip chart, calculate the distances on a road map and graph the data they collect.
Curated OER
Math, Sweet Math Activity Sheet
In this candy graphing worksheet, 1st graders will place candy on their paper to create a bar graph. They will answer several questions based on their data. A teacher checklist is provided.
Balanced Assessment
Stock Market
Analyze trends in the stock market using histograms. Future economists use data presented in a histogram to find periods of greatest increase and decrease. They also draw conclusions about days that would be best to invest.
Curated OER
Which Day of the Week Do You Like Best?-- Class Graph
In this math activity, students participate as a class to complete a bar graph. Students indicate which day of the week they like best, and the class plots the data on the bar graph.
Curated OER
Let's Graph It
In this let's graph it worksheet, student interactively answer 10 multiple choice questions about graphing data and types of graphs, then click to check their answers.
Curated OER
Problem-Solving Application: Use a Graph
In this problem solving worksheet, 6th graders use the problem solving steps of understand, plan, solve and look back to answer a graphing question.
Curated OER
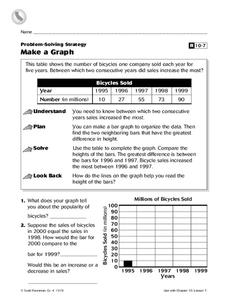
Make a Graph
In this graphs worksheet, 4th graders, after studying and analyzing a table on bicycles sold within several years, answer 2 short answer questions relating to the table.
Curated OER
Como llegas a la escuela?
What is the most popular way to get to school? Have students interview their peers to discover how and when they get to school. Then learners will graph the results. Consider providing statistics from other classes for your older...
Curated OER
M&M’s Math Worksheet
Who knew you could cover prediction, histograms, fractions, decimals, data collection, and averages (mean, median, and mode) all with a bag of M&M's®? Here's a fantastic set of worksheets to help you make candy a mathematical journey...
Curated OER
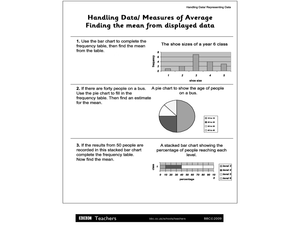
Handling Data/Measures of Average - Finding the Mean from Displayed Data
In this mean and average worksheet, students use the bars and charts to help them find the means using the given data. Students solve 3 problems.
Curated OER
High School Mathematics Problems from Alaska: Fire Fighting Crew
High schoolers apply mean, median and mode calculations of firefighter test scores to decide on hiring.
Los Angeles County Office of Education
Assessment For The California Mathematics Standards Grade 4
Have scholars show what they know with a 20-page assessment aligned to the California State Standards. The test covers concepts such as large and whole numbers, all four mathematical operations, fractions, decimals, geometric figures,...
Other popular searches
- Skittles Bar Graph
- Double Bar Graphs
- Bar Graphs Pictographs
- Histogram and Bar Graph
- Bar Graphs and Histograms
- Bar Graph Problem Solving
- Favorite Food Bar Graph
- Bar Graphs Histograms
- Interpreting Bar Graphs
- Bar Graphs for Birthdays
- Bar Graph Worksheet
- Bar Graphs and Charts


