Curriculum Corner
Second Grade Summer Math Practice Book
Stop the summer lag with a set of second grade Common Core based math practice sheets. Learners fill in hundreds charts with missing numbers up to 1,000. They practice writing numbers in standard, expanded, and word form. Children also...
Math Learning Center
Fourth Grade Assessments and Scoring Checklists, Common Core State Standards
Find out how your class is progressing in math with a set of assessments. Learners finish a baseline assignment to assess where they are beginning the year and then work on tests with increasing difficulty as the year progresses.
Math Learning Center
Third Grade Assessments and Scoring Checklists, Common Core State Standards
How are your learners doing with place value? Track their skill levels with a set of math assessments. The packet includes worksheets to hand out to your class, scoring checklists, a calendar for implementation, and instructions for use...
Los Angeles County Office of Education
Assessment For The California Mathematics Standards Grade 6
Test your scholars' knowledge of a multitude of concepts with an assessment aligned to the California math standards. Using the exam, class members show what they know about the four operations, positive and negative numbers, statistics...
Curated OER
Viruses: Tiny But Deadly
In this viruses worksheet, students read given information about the effect of viruses on people throughout history. Students create a bar graph comparing the viruses and answer seven questions based on the information they have learned.
Curated OER
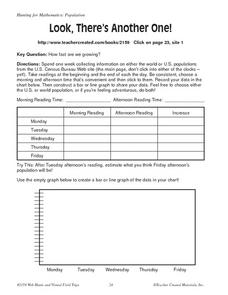
Look, There's Another One!
In this math worksheet, learners spend a week collecting information on either the word or U.S. populations from the U.S. Census Bureau Web site. Students record their data in a chart and bar graph. Learners also use the website to...
Curated OER
Grade 3 Mixed Math Practice- Mars, X
For this grade 3 mixed math worksheet, 3rd graders complete 9 problems. They work with fractions, nets, line segments, elapsed time, and a data table. They draw the bar graph to go with the data, and practice mental multiplication.
Curated OER
Chemistry Review
In this chemistry review worksheet, students read about atoms and the periodic table and they complete a chart using the periodic table to find the atomic number, atomic mass and group of given elements. Students answer 5 questions about...
Curated OER
Air Pollution:What's the Solution?-Weather's Role
In this air pollution and weather worksheet, learners collect data using an online animation to determine the air quality at given times along with the wind speed and temperature in a particular city. Students make 3 bar graphs using the...
Curated OER
Comparing And Ordering Decimals
In this decimals worksheet, students compare and order decimals using comparing symbols, ordering from least to greatest, answering word problems, and deciphering a bar graph. A very nice resource.
K12 Reader
Displaying Data
It's important to learn how to display data to make the information easier for people to understand. A reading activity prompts kids to use context clues to answer five comprehension questions after reading several paragraphs about...
Curated OER
Rainforest Data
In this geography learning exercise, students use the climate data given to create a temperature line graph and rainfall bar graph for each of three locations given. Then they use an atlas to compare their graphs and draw conclusions...
Curated OER
Destination of Slaves in 1800
In this slave trade worksheet, students use the provided Atlantic Slave Trade statistics to create a pie chart and a bar graph. Students also respond to 4 short answer questions.
Noyce Foundation
Ducklings
The class gets their mean and median all in a row with an assessment task that uses a population of ducklings to work with data displays and measures of central tendency. Pupils create a frequency chart and calculate the mean and median....
Curated OER
Impact Craters Activity
Lunar explorers perform an experiment to understand the size of the craters on the surface of the moon. They layer flour, laundry detergent, and cocoa powder in a pan to model the lunar surface. They drop marbles from different heights...
It's About Time
Volcanic Hazards: Airborne Debris
Pupils interpret maps and graph data related to volcanic ash. Then they analyze the importance of wind speed and the dangers of the ash to both life, air temperature, and technology.
Curated OER
Chances Are...
In this math worksheet, students perform 2 math investigations pertaining to probability--flipping pennies and rolling dice. Students record on the worksheet the results of each attempt, then graph the results. Note: The directions...
Curated OER
Heat: The Transfer of Thermal Energy
In this heat worksheet, students complete experiments with heat and answer short answer questions about the transfer of thermal energy. Students complete 4 questions, one chart, and one bar graph.
Curated OER
The Haar Wavelet Filter Bank
In this Haar Wavelet instructional activity, students solve and complete 4 different problems related to the Haar Wavelet filter bank. First, they define the properties of Haar basis. Then, students compute the matrices for the first,...
Curated OER
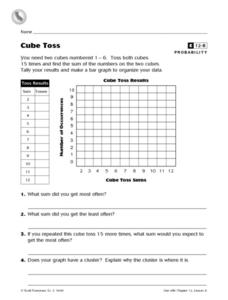
Cube Toss
In this probability and graphing worksheet, students solve 8 problems in which data from a cube toss is displayed on a table and graph. Students answer the questions about their results.
Curated OER
More Students Taking Online Courses
In this graph learning exercise, students study a bar graph that shows the number of college students taking at least one online course. Students answer 4 problem solving questions about the data on the graph.
Curated OER
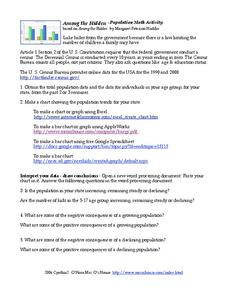
Among the Hidden - Population Math Activity
In this population worksheet, students collect data on population by researching the Census Bureau and then make online graphs and answer short answer questions about the data. Students complete 5 problems total.
Curated OER
Number of Cell phones in Use Per Household
For this cell phones worksheet, students study a bar graph of the number of cell phones usage in households. Students answer 5 questions about the graph.
Curated OER
Mean, Median, and Mode 1
For this mean, median and mode worksheet, students use the measures of central tendency to describe given statistical data. Students identify the range of data, and match data to its representative bar graph. Two multi-step problems...
Other popular searches
- Skittles Bar Graph
- Double Bar Graphs
- Bar Graphs Pictographs
- Histogram and Bar Graph
- Bar Graphs and Histograms
- Bar Graph Problem Solving
- Favorite Food Bar Graph
- Bar Graphs Histograms
- Interpreting Bar Graphs
- Bar Graphs for Birthdays
- Bar Graph Worksheet
- Bar Graphs and Charts


