Curated OER
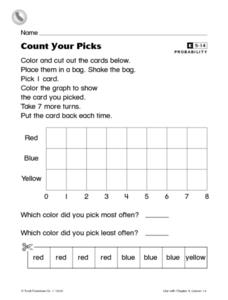
Count Your Picks
In this probability worksheet, students cut out 3 color cards and place them in a bag. Kids pick a card out of the bag 8 times, putting the card back each time. Students record their results on a bar graph.
Math Drills
Valentine's Day Ordering and Comparing (B)
Discover this Valentine's Day-themed worksheet where young mathematicians answer word problems using data tables.
Math Drills
Valentine's Day Ordering and Comparing (A)
Youngsters use a data table to answer questions, in a Valentine's Day-themed worksheet.
UAF Geophysical Institute
Observing the Weather
How can you predict the weather without any technology? Young scientists learn to forecast the weather using traditional Native American techniques. Based on their observations of the weather, as well as talking to their classmates, they...
UAF Geophysical Institute
Carbon Footprint
Your young environmentalists can calculate their carbon footprint and discuss ways to reduce it with a worksheet about climate change. After reading a handout about what impact one's carbon footprint can have on the environment, kids...
Education.com
Measure School Supplies
Ever wonder how long a pair of scissors are? Find out with this simple measuring activity in which pupils use the provided ruler to determine the length of four common classroom supplies.
Math Mammoth
Grade 1 Worktext
Use graphing, counting, and number lines to help first graders learn about addition and subtraction. An array of worksheets and activities are an excellent resource for your math lesson, whether you are focusing on counting skills...
Law for Kids
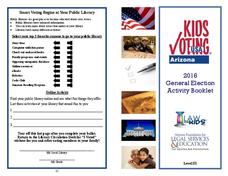
General Election Activity Booklet
It's never too early to practice smart voting! Gain practice voting in a general election using a booklet compiled of an assortment of activities including a word search, maze, graphing, and more!
Curated OER
Graph Made Easy-Pre Test Questions
In this graphing pre test worksheet, students complete a set of 10 multiple choice questions. Page is labeled as a pretest, an answer link is provided.
Curated OER
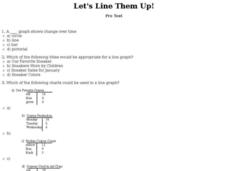
Let's Line Them Up!
For this line graph worksheet, students read through the problems about graphing and line graphs. Students select the best answer to solve the 10 online questions.
Curated OER
Numeracy Practice- Going Out For Lunch
In this math activity, students complete the various types of activities that include graphs, data tables, and completing number sentences.
Curated OER
Data Analysis
In this data analysis worksheet, pupils solve and complete 4 different types of problems. First, they reduce the data provided to find the means, and graph the means in a line graph. Then, students graph the data from each mixture shown...
Curated OER
Completing Frequency Diagrams from Displayed Data
In this frequency diagram learning exercise, students use a bar chart, stacked bar chart and pie chart to complete frequency tables. A reference web site is given for additional activities.
Curated OER
Athletics Datafile
In this computer worksheet, students load and open a copy of ViewPoint and Olympics. They explore the data by identifying how many men and women are contained in the file and which country has the most files. Then they plot a bar graph...
Curated OER
Grid Paper
For this math worksheet, students create a bar graph using a ten by ten grid paper. Students can also create shapes using the grid paper.
Curated OER
Birthday Moon
In this science worksheet, students describe and draw what the moon looks like in four phases. Students also research about what the phase of the moon was like on the day and year they were born. Students ask their classmates and...
Curated OER
Woodland Math Facts
For this Woodland math facts worksheet, students study and examine woodland weights of trees and shrubs, explore invertebrates and draw a bar chart to chart their findings.
Curated OER
Math Facts Speed Drill
In this math worksheet, students complete a bar graph titled "Math Facts Speed Drill." Students include their scores over eight different trials.
Curated OER
Apple Graph
In this apple graph activity, students survey their classmates to see what type of apple they enjoy eating the most. Students graph their data.
Curated OER
Histograms: Homework
In this histograms worksheet, students learn how to make a histogram. Students give graphs a title, draw the axes, label the vertical axis, choose an appropriate scale, and mark equal intervals. Students label the horizontal axis with...
Worksheet Web
Using Pictographs
If one ice cream cone represents three ice cream scoops, and Bob has four ice cream cones, then how many scoops does Bob have? Learners solve these kind of questions with their new understanding of pictographs.
Curated OER
Future Careers of Middle School Students
In this math worksheet, students examine the bar graph that is related to the statistics for the Careers of Middle School Students. They answer the five questions.
Curated OER
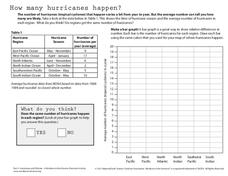
How Many Hurricanes Happen?
In this hurricanes activity, students use a data table showing the hurricane region and the average number of hurricanes per year to determine if the same number of hurricanes happen in each region by creating a graph. Then students...
Curated OER
Weather Data Analysis
In this weather worksheet, students read a data table comparing the temperature and weather conditions at three different locations. Students use this data to complete 8 fill in the blank, 1 short answer question, and one graph.
Other popular searches
- Skittles Bar Graph
- Double Bar Graphs
- Bar Graphs Pictographs
- Histogram and Bar Graph
- Bar Graphs and Histograms
- Bar Graph Problem Solving
- Favorite Food Bar Graph
- Bar Graphs Histograms
- Interpreting Bar Graphs
- Bar Graphs for Birthdays
- Bar Graph Worksheet
- Bar Graphs and Charts


