Curated OER
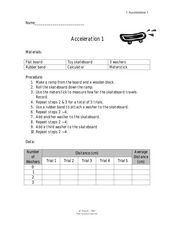
Acceleration 1
In this acceleration worksheet, students use weights to increase the mass affecting the force on moving objects. Students plot a graph of their data and answer 3 questions about how the acceleration of the toy skateboard used in the...
Curated OER
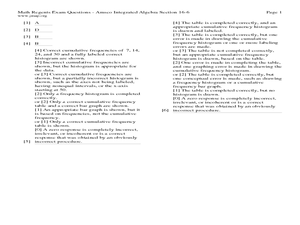
Quartiles, Percentiles, and Cumulative Frequency
In this statistics lesson, 11th graders are asked to calculate the percentiles, quartiles and cumulative frequency given different graphs and data. There are 6 questions with an answer key.
Curated OER
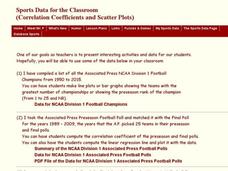
Sports Data for the Classroom
For this algebra worksheet,students rewrite word problems using algebraic expressions. They collect data and plot their findings on the graph and analyze it. There is an answer key for this worksheet.
Curated OER
Make a Frequency Table and a Histogram for a Given Set of Data
In this data recording and data organization worksheet, students create one frequency table and one histogram for a given list of data. Explanations and examples for frequency tables and histograms are given.
Curated OER
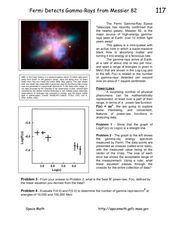
Fermi Detects Gamma-Rays from Messier
In this power law function worksheet, students use data from the Fermi Gamma-Ray Space telescope to apply the power law function to physical phenomena. Students use a graph to solve four problems.
Curated OER
Presentation of Quantitative Data- Vertical Line Diagrams
In this quantitative data worksheet, students examine how vertical line diagrams can be used to display discrete quantitative data. They read about the use of tally charts to create vertical line graphs that display the data. They...
Curated OER
Linear Equations
In this algebra worksheet, students solve linear equations and graph their answer. They add and subtract integers and compare them using a number line. There are 15 questions with an answer key.
West Contra Costa Unified School District
Talking About Distance, Rate and Time
Connect the tortoise and the hare fable to mathematics. Learners first identify key terms related to distance, rate, and time. They then solve distance/rate/time problems using different representations.
Georgia Department of Education
Math Class
Young analysts use real (provided) data from a class's test scores to practice using statistical tools. Not only do learners calculate measures of center and spread (including mean, median, deviation, and IQ range), but...
Curated OER
Novel Response "The Night of The Twisters"
In this language arts worksheet, students graph interest in each chapter that is read in the book Night of The Twisters. They use the graph to analyze class opinion of the book.
Curated OER
A Country’s Shape Is More Than Its Borders
For this geography skills worksheet, students read an article and examine graphs about population prior to answering 13 short answer questions and 10 multiple choice questions. Students then respond to the writing prompt about population.
Curated OER
Climate Types
In this weather worksheet, students describe the rainfall distribution found in two different areas of the world. Then they compare the various types of climates found around the world using the graphs shown on the sheet.
Curated OER
Morning Math / Homework Math
In this math worksheet, students complete ten exercises reviewing basic math skills related to place value, money, time, number sense, and graphing. A Homework Math sheet is also included reviewing the same skills.
Curated OER
Quartiles and Box-and-Whisker Plots
In this algebra worksheet, students identify the central tendencies as they solve a box and whisker plot graph. They identify the quartiles of the data. There are 4 questions with an answer key.
Curated OER
Analyze and Interpret Statistical Information
In this probability and statistics activity, 9th graders analyze and interpret histograms as they identify trends in the data. The two page activity contains four problems. Answers are provided.
Curated OER
Writing Linear Equations
In this math worksheet, students write the equations in slope intercept form for the equations that are graphed. They also create equations using slope and intercepts.
Curated OER
Using Systems of Equations
In this algebra activity, learners solve systems of equations. They use substitution, elimination and graphing to solve. There are 33 questions with an answer key.
Curated OER
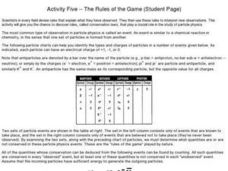
Particle Physics- Activity Five
In this particle physics worksheet, students use graphs and tables to predict the particles formed during a specific observation event. They complete 5 multi-part fill in the blank questions.
Curated OER
Two Variable Inequalities
In this algebra worksheet, students solve inequalities using addition, subtractions and multiplication. They graph the inequalities with shading. There are 2 questions.
Curated OER
Plotting Points
In this coordinate pairs worksheet, students learn to plot points on a graph. Students study the examples and then complete 20 questions. This is intended as an online activity, but may be completed with pencil and paper.
Curated OER
Worksheet 16 - Spring 1996
In this math worksheet, students read the instructions for setting up a computer program. Then they practice graphing the functions with the software program.
Curated OER
Histograms
In this histograms worksheet, students solve 5 word problems based on a histogram of presidential ages at their inauguration. Next, students create a frequency table and a histogram based on a list of data which shows the average...
Curated OER
Leveled Problem Solving: Histograms
In this using data, frequency table, and histogram to solve word problems worksheet, students solve problems about prices of toys and numbers of toys sold to solve consumer mathematics problems. Students solve six problems.
Curated OER
Pictures of Data
In this data worksheet, students look at maps and charts and answer multiple choice questions about them. Students complete 10 questions.
Other popular searches
- Skittles Bar Graph
- Double Bar Graphs
- Bar Graphs Pictographs
- Histogram and Bar Graph
- Bar Graphs and Histograms
- Bar Graph Problem Solving
- Favorite Food Bar Graph
- Bar Graphs Histograms
- Interpreting Bar Graphs
- Bar Graphs for Birthdays
- Bar Graph Worksheet
- Bar Graphs and Charts


