Curated OER
Creating a Bar Graph with a Graphing Program
Students use the S'COOL data base to create a bar graph.
Curated OER
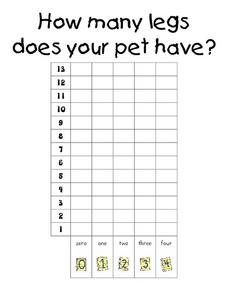
How Many Legs Does Your Pet Have?-- Class Bar Graph
For this math worksheet, students collaborate as a class to make a bar graph displaying how many legs the students' pets have. Results are plotted on the graph.
Curated OER
Numbers and Me
Students collect and graph data about themselves. In this collecting and graphing data lesson plan, students poll their classmates about how many siblings they have or they measure their height. Students make a bar graph of their data....
Curated OER
Great Graphing
Students collect data, use a computer spreadsheet program to create various graphs, and compare the graphs. They state the findings of each graph in writing and decide which graph type best represents the data.
Curated OER
Graphing Using Excel
Fifth graders complete a series of graphs by gathering information and using Excel to graph the information. In this graphing lesson plan, 5th graders graph favorite desserts of the class. Student put their results into the computer and...
Curated OER
Graphing Pasta
Students sort and graph various types of pasta. Using pasta construction paper patterns or real pasta, they sort the pasta by color, size, and type, and record the data on a graph.
Curated OER
A Reading Graph
Students construct and interpret a "favorite classroom books" graph. In this literacy and math graphing lesson, students choose a reduced size copy of the book cover that corresponds with the book(s) they chose to read during their...
Curated OER
Introductory Algebra Chapter 3 Review
In this math worksheet, students find the solutions to the problems while interpreting the line, bar, and circle graphs. The examples are given to help in the context of each objective.
Curated OER
Australian Settlers
Students interpret graphs and research events to identify links between events in the world and the arrival and plight of immigrant groups. They discuss the myths about immigration.
Curated OER
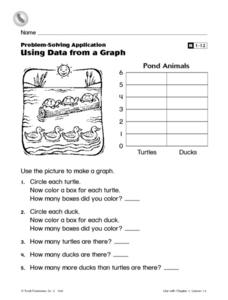
Using Data From a Graph
In this graphing worksheet, students create a bar graph with information from a picture of some pond animals. Students answer 5 questions about the graph.
Curated OER
Jump and Graph
Third graders practice measuring skills by jumping and measuring the lengths with yardsticks. After measuring five jumps each, they draw bar graphs representing their jumps.
Curated OER
Usage and Interpretation of Graphs
Young scholars review graphing and use processing skills to solve problems.
Curated OER
Graphing a Survey
In this mathematical worksheet, students survey a selection of thirteen people to find out if they like to eat ice cream, cakes or pies and then fill in their graphs with the data they've collected.
Curated OER
Graphing Predator/Prey Data
Learners use data from the Camouflage Game (played with red and green yarn caterpillars) to create a composite bar graph to display the collected data. They interpret the data and form a conclusion based on the graphs. Teachers may use...
Curated OER
Let's Graph It! Pre-Test
In this graphing worksheet, students complete a set of 10 multiple choice questions, clicking on a link to see correct answers or print the page.
Curated OER
Using Data to Make Graphs: Pretest
In this data worksheet, 5th graders answer multiple choice questions on data and graphs. Students answer 10 multiple choice questions.
Curated OER
Graphing Data Brings Understanding
Students collect, graph and analyze data. In this statistics lesson, students use circle, pie, bar and lines to represent data. They analyze the data and make predictions bases on the scatter plots created.
Curated OER
My Test Book: Reading Graphs
In this online interactive math skills worksheet, students solve 10 multiple choice math problems that require them to read and interpret graphs. Students may view the correct answers.
Curated OER
Graphs in the News
In this graphs instructional activity, students locate 2 kinds of graphs in the newspaper and answer short answer questions about them. Students complete 3 questions.
Curated OER
Money Circulation: A Story of Trade and Commerce
Middle schoolers are introduced to the meaning, symbolism, and value of the quarter. They determine the percentage of total monetary value held in quarters and graph the results. Students infer about the U.S. Mint's distrubution of...
Curated OER
Apple Adjectives
Study different apple varieties and use appropriate adjectives to describe them. Learners alphabetize both the apple names and the adjectives before creating spreadsheet, bar, and pie graphs. A mix of language arts, technology, and math!
Curated OER
Just Graph It!
Students practice collecting data and organizing it into graphs. As a class, they collect birthday information from each of their classmates. To continue practicing, they examine the characteristics of different bugs and zoo animals. ...
Curated OER
Line Graphs and Commercial Costs
Students investigate line graphs. For this middle school mathematics lesson, students compare and contrast different types of graphs and create line graphs based on the data provided.
Curated OER
Creating Circle Graphs using Excel
Fifth graders evaluate data from a circle graph that compares time spent on various activities. They use the computer to manipulate their own data as they compare, examine, create and evaluate data using circle graphs.
Other popular searches
- Skittles Bar Graph
- Double Bar Graphs
- Bar Graphs Pictographs
- Histogram and Bar Graph
- Bar Graphs and Histograms
- Bar Graph Problem Solving
- Favorite Food Bar Graph
- Bar Graphs Histograms
- Interpreting Bar Graphs
- Bar Graphs for Birthdays
- Bar Graph Worksheet
- Bar Graphs and Charts


