Curated OER
Twelve Days of Christmas
Learners create charts and graphs using a spreadsheet. They chart the number of each gift given day by day from the song, "The Twelve Days of Christmas." They create a bar graph and a circle graph from their data on the spreadsheet.
Curated OER
E3 Practice Assessment - Pets
In this assessment worksheet, 3rd graders complete eight pages of math assessment. Students solve problems related to money and a bar graph. Students solve word problems involving rounding and computation.
Curated OER
Raquel's Radishes
Sixth graders develop a reasonable hypothesis for a fictional science fair investigation. 'Raquel' is going to grow radishes and test for the best way to nourish them. They create a bar graph and write conclusions.
Curated OER
Do You Live in The Country Or in the City?
In this math worksheet, students participate in a group graphing project. Students survey classmates about where they live and plot the results on a bar graph.
Curated OER
How Many Buttons Do You Have Today?-- Classroom Graph
In this math worksheet, students collaborate as a class to record information about how many buttons each student has on any one day. Students plot the data on a bar graph.
National Security Agency
Are You Ready to Call the Guinness Book of Records?
Learners design questions that can be answered by collecting data. In this line-plot lesson, pupils collect data and graph on a line plot on world records. An abundant supply of teacher support is provided in this resource.
Curated OER
It's Freezing!
Here is a good activity for 5th grade scientists. In it, they look at a bar graph that shows the freezing point for a variety of liquids. Then, they are given a scenario of a certain liquid melting and freezing, and must determine which...
Curated OER
Music and Sports
With so much talent in the classroom, do your musicians and athletes have related interests? This problem has your learners taking data from their classmates to decide whether there is an association between the two activities. The...
ARKive
Handling Data: African Animal Maths
Handling and processing data is a big part of what real scientists do. Provide a way for your learners to explore graphs and data related to the animals that live on the African savannah. They begin their analysis by discussing what they...
Curated OER
TE Activity: A Tornado in My State?
Students study data about tornadoes in the United States while completing a worksheet. They develop a bar graph showing the number of tornadoes for the top ten states in the US. They find the median and mode of the data set.
Curated OER
The Appliance Explosion
Students explain why the number of appliances used today differs greatly from the number used previously. They construct a bar graph to show changes in appliance use over a period of time. They also list appliances that could be eliminated.
Curated OER
The Candy Color Caper
Young scholars explore the concept of probability. They calculate the probability of an event happening and graph their results. Students determine the probability of winning a sweepstakes. They construct a bar graph to represent all the...
Sharp School
Geography Project
This very simple geography project can lead to a lot of useful referential information that can be displayed in your classroom! Learners construct a poster-size map of a country, identifying major demographic points and including pie/bar...
Curated OER
Probability: What's Most Likely?
Work with graphs, tally marks, and probability. Fifth graders read tables with different sets of data, including tally marks and a bar graph, to answer five questions. Use this activity as part of a probability lesson, or as a homework...
Curated OER
Moo-Velous Butter!
Third graders investigate how temperature and motion (energy) create a chemical change that turns cream ( a liquid) into butter (a solid). They create a class pictograph of their favorite mils choices (white, chocolate, or strawberry)...
Curated OER
M&Ms Count and Crunch
Middle schoolers practice skills involving statistics and probability by making predictions on number of each color candy in one pound bag of M&Ms. They record both guesses and actual quantities, calculate percentages, and create bar...
Illustrative Mathematics
Color Week
Practice counting by ones up to 20 with your kindergartners using this colorful class experiment. There are two versions for the lesson. Version 1: The Friday beforehand, send home a notice for the week assigning a different color for...
Curated OER
Taste Test
Third graders practice creating bar graphs by conducting a taste test. In this graphing lesson, 3rd graders taste several different brands of peanut butter and discuss among their classmates which tastes better. Students create a bar...
Curated OER
First Day of Class
Students create birthday bar graphs, read books, make math windows, and more for the first day of math class. In this first day of class lesson plan, students also create pyramids.
Curated OER
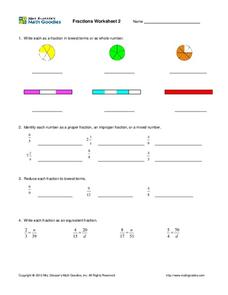
Fractions: pie graphs, numbers, and bars
In this fraction worksheet, middle schoolers complete fraction problems containing pie graphs, numbers, bars, proper fractions, lowest terms, and more. Students complete 19 problems.
Curated OER
Investigating: Interpreting Graphs and Analyzing Data
Students explore statistics by researching class birthday data. In this data analysis lesson, students investigate the different birthdays among their classmates and create data tables based on the given information. Students view bar...
Curated OER
Graphing Fun
First graders analyze objects and make a graphing picture to analyze the data. In this graphing lesson, 1st graders complete an object graph assessment, a picture graph assessment, and a bar graph assessment to analyze their given objects.
Curated OER
5 Sense Bear
Students become familiar with their five senses through the creation of a sense bear. In this five senses lesson, students create a bear and add cinnamon and a candy cane to the bear. Students use their five senses with this bear...
Curated OER
Range and Mode
Students interpret data from graphs. In this range and mode activity, students review a tally chart, pictograph and bar graph. Students use these graphs to calculate the range and mode of each set of data.
Other popular searches
- Skittles Bar Graph
- Double Bar Graphs
- Bar Graphs Pictographs
- Histogram and Bar Graph
- Bar Graphs and Histograms
- Bar Graph Problem Solving
- Favorite Food Bar Graph
- Bar Graphs Histograms
- Interpreting Bar Graphs
- Bar Graphs for Birthdays
- Bar Graph Worksheet
- Bar Graphs and Charts


