Curated OER
Frequency Histograms, Bar Graphs and Tables
In this statistics worksheet, students graph their data using frequency histograms, bar graphs and tables. They decide which graph shows the data best. There are 6 graphing problems.
Curated OER
Choose an Appropriate Graph
In this graphs worksheet, students solve 6 fill in the blank problems where they choose the most appropriate type of graph for each set of data and explain why they chose that type. Students use bar graphs, histograms and circle graphs....
Curated OER
Sort and Graph
In this sorting and graphing worksheet, students sort 15 objects and then fill in bar graphs to tell how many of each shape there are. The shapes are: heart, star and triangle.
Curated OER
Use a Bar Graph
In this bar graph worksheet, students use a given bar graph to answer a set of 3 questions. Answers included on page 2.A reference web site is given for additional activities.
Curated OER
Bar Graphs
In this bar graphs worksheet, pupils, working with a partner, explore how to read and analyze the five answers to one mathematical bar graph.
Curated OER
Making Bar Graphs
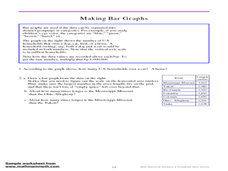
In this bar graph worksheet, students answer short answer questions about bar graphs. Students answer 1 question about a bar graph about a cat, and 3 questions about a bar graph about U.S. rivers.
Curated OER
Study Buddies - Bar Graphs
In this data collection worksheet, students work with a partner to make 3 small bar graphs after finding the proper number of circles on the first page. They look at a page of a variety of shapes and separate the circles into black,...
Curated OER
Problem Solving Application: Using a Bar Graph
In this bar graph worksheet, students use a set of 2 bar graphs to answer 6 related questions. Answers are included on page 2. A reference web site is given for additional activities.
Curated OER
Bar Graph: Vacation Fun
In this bar graph worksheet, students use a bar graph showing pictures taken on a vacation to complete 6 related questions. Answers are included on page 2.
Curated OER
Making a Bar Graph
In this bar graph worksheet, students analyze a data table and bar graph depicting information about stickers collected. Students answer 5 questions about the data displayed.
Curated OER
Interpreting a Bar Chart
In this interpreting bar charts worksheet, students examine a bar chart that shows how many people traveled on boats that took them out dolphin watching. They answer 8 questions about the times and number of people on the boats.
Curated OER
Mean, Mode and Bar Graphs
In this mean, mode and bar graphs activity, 5th graders analyze the data given, then answer three questions about a bar graph and the data shown.
Curated OER
Easter Bar Graph - (B)
In this math review worksheet, learners complete addition, subtraction, multiplication, and division problems and put their answers into a bar graph that represents calories. Students complete 13 problems and 1 graph.
Curated OER
Make and Read Bar Graphs
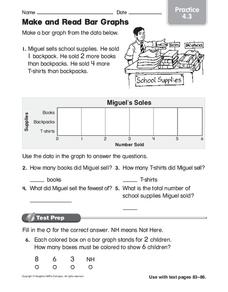
In this bar graphs worksheet, students make a bar graph about the sale of school supplies with the data presented in one story problem.
Curated OER
Frequency Histograms, Bar Graphs and Tables #3
For this frequency histograms worksheet, students examine bar graphs, histograms and tables. They identify the model of information that best matches the statistics. This three-page worksheet cotnains two multiple-choice...
Curated OER
Create a Bar Graph
In this bar graph worksheet, students use a set of clues about favorite types of books to draw the bars on a graph. Answers are included on page 2.
Curated OER
Easter Bar Graph- A
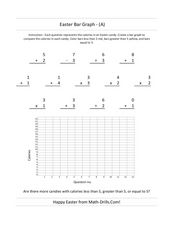
In this Easter math worksheet, students first solve 13 problems with addition, subtraction, multiplication and division. Using the answers, students make a bar graph.
Curated OER
Easter Bar Graph - C
In this math review worksheet, learners complete addition, multiplication, division, and subtraction problems where each answer is inserted into a bar graph. Students complete 13 problems.
Curated OER
Easter Bar Graph - (E)
In this math review worksheet, students complete addition, multiplication, division, and subtraction problems where each answer is put into an Easter bar graph. Students complete 13 problems.
Curated OER
Easter Bar Graph - (D)
In this math review worksheet, students complete addition, multiplication, division, and subtraction problems where each answer is put into an Easter bar graph. Students complete 13 problems.
Curated OER
Bar Graph Activity: Spelling Bee
In this bar graph worksheet, students use information about a class spelling bee, shown in a bar graph, to complete a set of 7 related questions. Answers included on page 2.
Curated OER
Horizontal Bar Graph-- Blank Grid
In this math worksheet, students use the blank horizontal bar graph to record and display any data and to learn the correct way to generate a bar graph. Spaces are marked for students to write in the title and labels; intervals of 1-10...
Curated OER
Activity: Make a Bar Graph
In this bar graph worksheet, students use a given picture to create a graph, then use the graph to solve 2 related problems. Graph is sports related.
Curated OER
Reading Bar Graphs
In this bar graphs learning exercise, 8th graders solve and complete 10 different problems that include interpreting two different bar graphs. First, they determine the least profitable year for selling books. Then, students determine...
Other popular searches
- Skittles Bar Graph
- Double Bar Graphs
- Bar Graphs Pictographs
- Histogram and Bar Graph
- Bar Graphs and Histograms
- Bar Graph Problem Solving
- Favorite Food Bar Graph
- Bar Graphs Histograms
- Interpreting Bar Graphs
- Bar Graphs for Birthdays
- Bar Graph Worksheet
- Bar Graphs and Charts


