Curated OER
Shapes Graphing
In this graphing data worksheet, students examine the 11 shapes pictured and use that information to finish an incomplete bar graph.
Curated OER
Human Population Growth
In this human population growth worksheet, learners create a graph of human population growth and predict future growth using the data given in a chart. Students identify factors that affect population growth.
Curated OER
Statistics Related to the First World War
In this history and probability worksheet, students examine a chart of statistics associated with World War I which include total of men in the war by nation, number of deaths, and number of men taken prisoner. They answer 5 questions...
Curated OER
Easter Candy Count
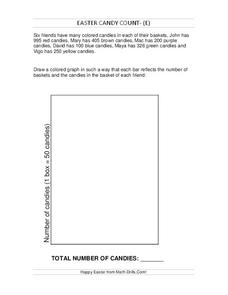
In this bar graph worksheet, students fill in the bar graph with the information of Easter candy that each child has and find the total. Students fill in 6 bars in the bar graph.
Curated OER
Easter Candy Count
In this bar graph worksheet, students fill in the bar graph based on the information about Easter candy that each child got. Students complete 6 spaces in the bar graph and find the total number of candies.
Curated OER
Easter Candy Count
In this bar graph instructional activity, students complete a bar graph based on the information of Easter candy they are given for each color. Students complete 6 spaces in the bar graph and find the total.
Curated OER
Easter Candy Count
In this bar graph learning exercise, students complete a bar graph based on the information of Easter candy they are given for each color. Students complete 6 spaces in the bar graph and find the total.
Curated OER
Easter Candy Count
In this bar graph worksheet, students complete a bar graph based on the information of Easter candy they are given for each color. Students complete 6 spaces in the bar graph and find the total.
Curated OER
Fourth Grade Mathematics Quiz
For this math worksheet, 4th graders complete multiple choice questions about multiplication, bar graphs, rounding, and more. Students complete 15 questions.
Curated OER
How Many of Each Coin Do We Have in Our Bag?-- Class Bar Graph
In this math worksheet, students participate in a group project to record the kind of coins they pick at random from a bag. Students record the data on this classroom bar graph.
Willow Tree
Histograms and Venn Diagrams
There are many different options for graphing data, which can be overwhelming even for experienced mathematcians. This time, the focus is on histograms and Venn diagrams that highlight the frequency of a range of data and overlap of...
Curated OER
Graphs: Favorite Pet Graph
In this graphing learning exercise, students use the data from a tally chart to create a bar graph. The graph template is provided, and students fill in the bars.
Curated OER
THE EASTER BUNNY GETS READY! PICTURE GRAPH
In this graphing instructional activity, students read a picture graph about colors of Easter eggs and then answer questions about the graph.
Curated OER
Favorite Pet
In this math learning exercise, 2nd graders study the pictograph of favorite pets. Students then answer nine questions pertaining to the given graph.
Curated OER
Histograms: Practice
In this histograms worksheet, students use the bar graph histogram to answer questions 1-4 and the tally chart for question 5. Students finish with two test prep questions.
Curated OER
Frequency Tables and Histograms
In this graph worksheet, 5th graders study the data presented on a bar graph. Students then respond to 4 short answer questions using the information that has been provided.
Curated OER
Are Yellow, Green, Or Red Apples Your Favorite To Eat?-- Class Bar Graph
In this math worksheet, learners collaborate to complete a bar graph about favorite apples. Students plot the information from their class on a simple bar graph.
Curated OER
What Do You Like on Top of Your Pizza Most? --class Bar Graph
For this math worksheet, students participate in completing a bar graph as a class. Students survey classmates as to their favorite pizza toppings and plot the results on this bar graph.
Curated OER
How Do You Like Your Sandwich? --class Bar Graph
For this math worksheet, students participate in a group bar graph activity. Students survey their classmates on favorite sandwich choices: peanut butter and jelly, grilled cheese or meat. Results are plotted on a bar graph.
Curated OER
How Many Brothers And Sisters Do You Have? -- Class Bar Graph
In this math worksheet, students collaborate in generating a class bar graph which displays information about how many brothers and sisters each classmate has. Data is plotted on a bar graph.
Curated OER
Which Kind of Weather Do You Like Best? -- Class Bar Graph
For this math worksheet, students generate a class bar graph. Classmates are surveyed about favorite weather: sunny, rainy, snowy, cloudy or windy. Results are displayed on a bar graph.
Curated OER
Write Larger Numbers in Words or Figures
In this reading a bar graph worksheet, students identify numbers to answer word questions. In this short answer worksheet, students answer five questions.
Curated OER
Bluebird Eggs in Nestbox chart
In this bluebird eggs worksheet, students fill out the chart which resembles a bar graph on how many eggs each bluebird has and answer short answer questions. Students answer 5 questions.
Curated OER
Animal Habitat Bar Graph
In this graphing worksheet, students examine a prepared bar graph and record which habitat their chosen animal lives in: desert, city, forest, ocean, prairie, or fresh water. There are no directions but it appears that a class could use...
Other popular searches
- Skittles Bar Graph
- Double Bar Graphs
- Bar Graphs Pictographs
- Histogram and Bar Graph
- Bar Graphs and Histograms
- Bar Graph Problem Solving
- Favorite Food Bar Graph
- Bar Graphs Histograms
- Interpreting Bar Graphs
- Bar Graphs for Birthdays
- Bar Graph Worksheet
- Bar Graphs and Charts


