Virginia Department of Education
Graphs
Examine different types of graphs as a means for analyzing data. Math scholars identify the type of graph from a series of data displays and then develop questions to match each one. Then, given a scatter plot of height versus age data,...
Curated OER
Color Graphs and Poetry
Students explore color as they create graphs, write poetry, and examine varied interior designs. They respond to writing prompts describing their favorite color. Students collect data and create a bar graph based on a class survey. They...
Curated OER
Introduction to Representing and Analyzing Data
Represent data graphically. Allow your class to explore different methods of representing data. They create foldables, sing songs, and play a dice game to reinforce the measures of central tendency.
Curated OER
ABC...Have Fun With Me!
Throw out those old ABC worksheets and try some new and engaging hands-on activities to teaching the alphabet!
School Sparks
Christmas Worksheets for Santa's Little Helpers
Just because children aren't in the classroom over winter break, doesn't mean that learning has to stop. Intended as a resource for parents, this eBook provides Christmas-themed worksheets and activities that engage children in...
Curated OER
Graphing in an Experimental Context
Seventh graders discuss the importance of being able to represent scientific data in the form of graphs. They comprehend the differences between a bar graph and a line graph. Students identify the type of data with which each graph...
Curated OER
Use Information in Line, Bar, Circle, and Picture Graphs to Make Comparisons and Predictions
Eighth graders explore the concept of graphs. In this graphs lesson, 8th graders compare and contrast picture graphs, bar graphs, line graphs, and circle graphs. Students examine each type of graph and answer questions and make...
Curated OER
Graphing Using Cookies
Students differentiate between bar graphs, line graphs, pictographs and bar graphs. After participating in a hands-on cookie activity, students label and draw their own graphs.
Curated OER
Graphing Data
First graders learn how to display data using a bar graph. In this bar graph lesson, 1st graders use data from a t-shirt color survey to make a bar graph. They also make an animal bar graph before interpreting the information.
Curated OER
Graphs
Learners investigate circle and bar graphs. In this middle school mathematics lesson, students determine which kind of graph is suitable for a given situation and create circle and bar graphs.
Curated OER
Color Tile Graphing
Students explore data. They gather data and generate questions about the data in pictographs, tallies, tables, and bar graphs. Students use color tiles pulled by random to create their own bar graph. They discuss the bar graphs they...
Curated OER
Charting and Graphing Sales
Students analyze and represent weekly sales figures using tables, bar graphs, and pie charts. They draw conclusions using bar graphs and pie charts. Students are told that each day at school they have the option of buying or bringing a...
Curated OER
Wheat Kernels Bar Graph
Third graders create a bar graph to record how many kernels were in a wheat stalk. They write in math journals two questions from interpreting the graph. They solve math problems from other students.
Curated OER
Choosing the Best Graph
In this mathematics worksheet, 6th graders use a line graph to illustrate how a measure of data changes and explain their reasoning. Then they use a bar graph to compare pieces of data and a pictograph to compare data.
Curated OER
Graphing in the Information Age
Students create a variety of graphs based on population data. In this statistics instructional activity, students use data that can be gathered on-line to make a bar chart, line graph, and circle graph.
Curated OER
Counting And Graphing
Students explore counting and graphing. In this math lesson plan, students practice counting from 1-25 and are exposed to two types of graphs: the pie graph and the bar graph. Students use Skittles to represent a variety of measurements.
Curated OER
Graph Made Easy: Post Test
For this graphs worksheet, learners answer multiple choice questions about line graphs and bar graphs. Students answer 10 questions total.
Curated OER
Smarties Pictogram and Bar Chart
In this math learning exercise, students create a bar chart to illustrate the number of Smarties they have in each color. Students also draw a pictogram to represent the same information.
Curated OER
Census Statistics and Graphing
Students graphically represent data from the Census. In this middle school mathematics lesson, students investigate the housing characteristics of different tribes of Native Americans and compare them to the average American...
Curated OER
Misleading Graphs
Students explore number relationships by participating in a data collection activity. In this statistics instructional activity, students participate in a role-play activitiy in which they own a scrap material storefront that must...
Curated OER
How Do They Measure Up? Measure and Graph
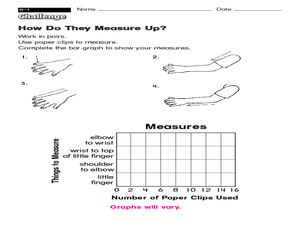
In this measure and graph worksheet, students use paper clips to measure various lengths shown, then bar graph their results, a total of 4 measurements.
Curated OER
Graphing Our Favorites
Second graders use a computer program to follow directions and graph their favorite things into a bar graph. In this graphing lesson plan, 2nd graders have 30 choices of favorite things to graph.
Curated OER
Horizontal Bar Graph: Changes in Nebraska Population
In this bar graph worksheet, students learn about the changes in Nebraska's population from 1880 to 2000 by studying a bar graph. Students answer 7 questions about the graph.
Curated OER
M&M's Candies Worksheet Graph
In this graphing worksheet young scholars will record data on a bar graph. Students will take a bag of M&M's and chart the colors they find inside this bag.


