Curated OER
North vs. South
Students use information about the Union and Confederate troops to create a bar graph. For this graphing lesson, students graph troop information on a bar graph, color coding the information. Students then find the differences between...
Curated OER
Dynamite Data
Second graders rotate through a variety of stations designed to offer practice in manipulating data. They sort, tally and count items and then create bar graphs, tables, and pie graphs to record their findings.
Curated OER
Dealing With Data
Students collect, organize, and display data using a bar graph, line graph, pie graph, or picture graph. They write a summary describing the data represented and compare the graph to another graph in the class.
Pennsylvania Department of Education
Up on Top
Students make bar graphs and identify items in the bar graphs as being likely, certain, or impossible. In this bar graphs lesson plan, students answer questions about the bar graphs using reasoning and communication skills.
Curated OER
Suicides And Suicide Rates
Students investigate suicide using a variety of criteria and create a bar graph before discussing the results as a class.
Curated OER
Heart to Heart
Students predict the outcome of a question and conduct a survey and record their findings on a bar graph.
Curated OER
Introduction to Dr. Seuss
First graders look at slides on the SMART Board of different facts about Dr. Seuss and then create a class bar graph of their favorite Dr. Seuss books. In this Dr. Seuss lesson plan, 1st graders review and list facts that they learned...
Curated OER
What's the Weather?
Second graders make daily weather observations, record them with appropriate stickers on a chart, and then summarize them at the end of the week in the form of a bar graph.
Curated OER
Using Data
In this analyzing data worksheet, 4th graders read, study and interpret a bar graph on how many hours Millie spends a week drawing each day. Students answer 2 short answer questions relating to the bar graph.
Curated OER
Match Game: Enrichment
In this solid figures worksheet, learners choose a shape from the box that fits the bar graph totals for the faces, edges, and vertices. Students then complete the last bar graph using the one unused shape.
Curated OER
Pecan Power
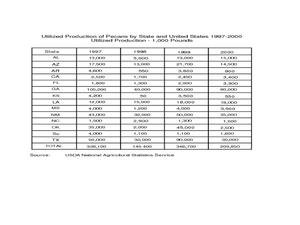
Young scholars study the origins of pecans and complete a bar graph from the data they have discovered. In this pecan lesson plan, students draw pecans, discuss a pecan time line, and draw a bar graph comparing Arizona pecans to other...
Curated OER
Temperature
Learners explore the concept of temperature. In this temperature lesson, students read thermometers in degrees Celsius. Learners discuss the temperature of the seasons and what clothing they might wear given a certain temperature....
Curated OER
Transportation Math
Students explore the concept of exponents. In this exponents lesson, students evaluate various bases to powers. The bases to a given power are in the context of miles driven, stops on a route, and minutes spent in route. Students read...
Curated OER
Ice Cream Scoop
For this data display worksheet, students write 6 flavors of ice cream on pieces of paper. Students choose papers one at a time and keep track on a tally sheet. Students make a bar graph of the results.
Curated OER
Lucky Charms Sort
Students make a bar graph. In this sorting and counting lesson, students use the Lucky Charms cereal to sort the marshmallows into separte cups, count how many marshmallows are in each cup and make a bar graph to compare the numbers.
Curated OER
Statistical Inquiry
In this statistical inquiry worksheet, students analyze and interpret a variety of diagrams such as a scatter plot, bar graph and pie charts. They create tables and other diagrams to support given data. This two-page worksheet contains 3...
Curated OER
Review of the Scientific Method
Learners review the Scientific Method with a hands-on activity. Working with a partner, they hypothesize the number of water drops that fit on the heads side of a penny. They collect data and share their results with the remainder of...
Curated OER
Shapes Graphing
In this graphing data worksheet, students examine the 11 shapes pictured and use that information to finish an incomplete bar graph.
Curated OER
Human Population Growth
In this human population growth worksheet, learners create a graph of human population growth and predict future growth using the data given in a chart. Students identify factors that affect population growth.
Curated OER
Graphing with Stems-and -Leafs
Fourth graders examine the use of stem and leaf graphs. For this stem and leaf graph lesson, 4th graders participate in teacher led lesson showing the use of the graphs. They work in groups to collect data about peanuts before making a...
Curated OER
Measuring Inches
First graders measure the length of pipe cleaners to form worms using rulers to focus on inches. They record their results and graph the measurement of each pipe cleaner. They measure their pipe cleaner "worms" in various colors and...
Curated OER
Statistics Related to the First World War
In this history and probability worksheet, students examine a chart of statistics associated with World War I which include total of men in the war by nation, number of deaths, and number of men taken prisoner. They answer 5 questions...
Curated OER
Graphing with the Five Senses
Students collect data and record it on a bar graph. In this data graphing lesson, each small group of students is assigned to collect data on one of the five senses. They then practice a song that helps them remember the purpose of each...
Curated OER
Graphing Our Snacks
Students gather information from Nutrition Facts labels on their favorite snack foods. They graph the fat content of the foods and reflect on what they see.


