Curated OER
Food Chains
Students study food chains by creating their own slide show using KidPix. They compare information after sharing their slide shows as a whole group. As the children are watching the slide shows of their peers, they tally every time...
Curated OER
An Inside Look at Apples
First graders examine and identify parts of an apple. In this biology lesson, 1st graders cut an apple in half and locate all the parts, use the apple halves as stamps, and create a bar graph displaying which apple types the students...
Curated OER
Simply the Best
Students determine whom they consider "the best" performer in a variety of entertainment industries and discuss how to accurately measure greatness. They create bar graphs comparing statistics of the 1975 Cincinnati Reds and the 1998 New...
Curated OER
Temperature in the Sun or Shade of the Desert
Third graders use thermometers to measure the air temperature in several
places around the school and then return to the classroom to record the data. They create a bar graph and discuss their findings about the air temperature in the...
Curated OER
TV Survey - Data Collection and Analysis
In this data collection and analysis worksheet, 4th graders complete a tally chart about the number of hours that fourth graders watch television. They create a bar graph with the information, write a paragraph about the survey results,...
Curated OER
Flight of Angles of Inclination
Students measure the flight of a gilder. In this fight of angles lesson, students explore the flight of a glider and measure the distance flown. They collect statistical data of the flights and determine the slope of each flight. ...
Curated OER
Testing for Vitamin C in Different Drinks and Foods
Students examine the importance of vitamin c in their diets and the sources that it comes from. In this vitamin lesson students complete hands on activities, interpret data and make a bar graph.
Curated OER
Skittles, Taste the Rainbow
Fifth graders learn and then demonstrate their knowledge of a bar and a circle graph using the classroom data. Students are given a pack of skittles candy. Students create a bar and circle graph indicating the results of the contents of...
Curated OER
Show Me!
Students analyze and interpret graphs. In this graphing lesson, students view a video and construct their own graphs (line, circle, bar) from given sets of data.
Curated OER
Pictures of Data: Post Test
In this data worksheet, students answer multiple choice questions about charts and graphs. Students answer 10 questions total.
Curated OER
A Thanksgiving Survey
Students conduct a survey. In this math lesson, students design and conduct a survey about Thanksgiving foods. Students display the collected data in a graph and use the graph to determine what food to serve for a Thanksgiving meal.
Curated OER
Technology Literacy Challenge Grant Learning Unit
First graders explore counting and classification. They sort leaves, create graphs, write sentences for the data in the graphs, develop graphs for shapes, favorite animals, birthdays, and participate in a die prediction game.
Curated OER
French Fry Run
Student explore estimation and measurement. In this measurement lesson, 2nd graders measure french fries, graph their data, and determine the size of french fries that is the best value. Students practice how to add prices and calculate ...
Curated OER
Introduction to Descriptive Statistics with Mode, Median, Mean and Range
Learners complete several games and experiments, tally and graph their results. They figure the mean, median, range and/or average of their graphs to describe class results. They consider which statistic best represents the data at hand.
Curated OER
Local Traffic Survey
Young scholars conduct a traffic survey and interpret their data and use graphs and charts to display their results.
Curated OER
Line & Scatter (What Would You Use: Part 2)
Learners discuss line graphs and scatter plots and the best situations in which to use them. Using the graphs, they determine the type of correlation between variables on a scatterplot. They create a scatterplot and line graph from a...
Curated OER
The Snack Bar
Sixth graders complete a purchase order. In this ratios and patterns lesson, 6th graders work in groups to complete a purchase order for a grand opening of the school snack bar. Students use rations to figure out the need and quantity...
Curated OER
A Thanksgiving Survey
Students take a survey then use the information gained from the survey to help plan a typical Thanksgiving dinner for our last day of class. They create a graph which corresponds the the data gathered during interviews.
Curated OER
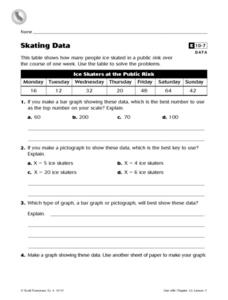
Skating Data
In this collecting data worksheet, 4th graders view a table on ice skaters at a public rink in order to answer 2 multiple choice questions, 1 short answer question and make a graph showing one piece of the data.
Curated OER
Tracking Olympic Gold!
Students use print or online resources to track the results of the Olympic Games, record daily results on graphs, use graphs to collect information.
Curated OER
Graphing Absolute value Inequalities
Students investigate the concept of inequalities and practice graphing them at various degrees of difficulty. They review the basic rules with the teacher at the level of theory which may make it harder for them to understand without...
Curated OER
Counting
Second graders comprehend how to use two different kinds of graphs. They complete a worksheet with the help of the teacher and a bag of jellybeans and then another worksheet without the direction of the teacher. Students listen as the...
Curated OER
Gingerbread Man Math
Students collect and explore gingerbread man data. In this math and technology lesson plan, students examine how to organize and interpret data in three formats: objects, pictures, and graphs.
Curated OER
Where Did We Go on Holiday This Year?
For this differentiated whole-group activity worksheet, students list all the places they visited over the summer, record the places on a flip chart, calculate the distances on a road map and graph the data they collect.


