Shodor Education Foundation
Data Flyer
Fit functions to data by using an interactive app. Individuals plot a scatter plot and then fit lines of best fit and regression curves to the data. The use of an app gives learners the opportunity to try out different functions to see...
CK-12 Foundation
CK-12 Middle School Math Concepts - Grade 6
Twelve chapters cover a multitude of math concepts found in the Common Core standards for sixth grade. Each title provides a brief explanation of what you will find inside the chapter—concepts from which you can click on and learn more...
Los Angeles County Office of Education
Assessment For The California Mathematics Standards Grade 4
Have scholars show what they know with a 20-page assessment aligned to the California State Standards. The test covers concepts such as large and whole numbers, all four mathematical operations, fractions, decimals, geometric figures,...
Curriculum Corner
Second Grade Summer Math Practice Book
Stop the summer lag with a set of second grade Common Core based math practice sheets. Learners fill in hundreds charts with missing numbers up to 1,000. They practice writing numbers in standard, expanded, and word form. Children also...
Radford University
Marketing Mayhem: Advertising for Adolescents
You'll be sold on using the resource. Future consumers first conduct a sample survey on marketing strategies. They then consider how mass media influences their age groups and create presentations to display their findings.
American Statistical Association
Candy Judging
Determine the class favorite. The statistics lesson plan has pupils collect, display, and analyze data. Pairs rank four kinds of candy based on their individual preferences. Working as an entire class, learners determine a way to display...
American Statistical Association
Spinners at the School Carnival (Equal Sections)
Spin to win a toy car. A fun activity has pupils use a spinner in which three of the equal sections represent winning a toy car, and the fourth section represents no car. They record the number of wins after certain numbers of spins,...
Math Learning Center
Fourth Grade Assessments and Scoring Checklists, Common Core State Standards
Find out how your class is progressing in math with a set of assessments. Learners finish a baseline assignment to assess where they are beginning the year and then work on tests with increasing difficulty as the year progresses.
Math Learning Center
Third Grade Assessments and Scoring Checklists, Common Core State Standards
How are your learners doing with place value? Track their skill levels with a set of math assessments. The packet includes worksheets to hand out to your class, scoring checklists, a calendar for implementation, and instructions for use...
Houghton Mifflin Harcourt
Unit 1 Math Vocabulary Cards (Grade 1)
Reinforce mathematical vocabulary with the use of flash cards. Each card showcases a boldly typed word as well as a labeled picture representation of the word. Terms include addition, subtraction, greater than, less than, and more!
Los Angeles County Office of Education
Assessment For The California Mathematics Standards Grade 6
Test your scholars' knowledge of a multitude of concepts with an assessment aligned to the California math standards. Using the exam, class members show what they know about the four operations, positive and negative numbers, statistics...
Curated OER
Line 'Em Up!
Students find coordinate points on a grid and create a line graph with those points. This lesson should ideally be used during a unit on various types of graphs. They make and use coordinate systems to specify locations and to describe...
Curated OER
Gummy Bear Picture Graph
First graders investigate picture graphs. In this graphing instructional activity, 1st graders create a picture graph with the x-axis being number and the y-axis being color. Students sort their gummy bears by color and use pictures of...
Curated OER
Animals Finding Rice Paddies
Fourth graders examine the animals who live in rice paddies and create a chart. For this rice lesson, 4th graders link the types of animals living in each ecosystem with a bar graph. Students use colored bars to show animals that live...
Curated OER
Celebrate Hispanic Heritage Month!
Students use information from the U.S. Bureau of the Census to create a bar graph, a picture graph, or a circle graph showing the country of origin of U.S. Hispanics.
Curated OER
The North (Wall) Star
Students engage in a lesson which shows them that celestial navigation is the art and science of finding one's geographic position by means of astronomical observations, particularly by measuring altitudes of celestial objects - sun,...
Curated OER
Biodiversity
Students investigate the diversity of temperate forests and tropical rainforests. They catch and observe local insects, sort leaves and insects on a chart, listen to the book "A Walk in the Rainforest," and create a class bar graph that...
Curated OER
Relative Dating-Telling Time Using Fossils
Students explore how to read fossil range charts. They develop an knowledge of the strengths and weaknesses of the fossil record. Students become familiar with the concepts index fossil and fossil range. Students use bar graphs to...
Curated OER
Constancy and Change
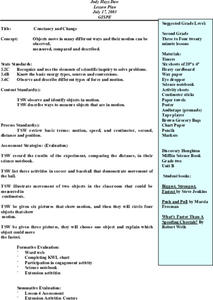
Second graders investigate how objects can move in different ways. They move in different ways across the room and develop a class list of movement words. Students also conduct a measuring motion experiment, create a bar graph for the...
Curated OER
Fabulous Forensic Fingerprints
Learners explore the uniqueness of each person's individual body. They identify traits and characteristics of the human body, with a main focus on the uniqueness of fingerprints and footprints. Students examine and compare fingerprints....
Curated OER
Viruses: Tiny But Deadly
In this viruses worksheet, students read given information about the effect of viruses on people throughout history. Students create a bar graph comparing the viruses and answer seven questions based on the information they have learned.
Curated OER
Look, There's Another One!
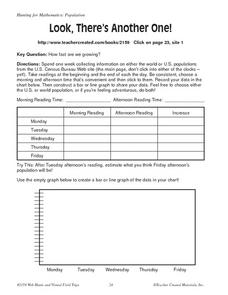
In this math worksheet, learners spend a week collecting information on either the word or U.S. populations from the U.S. Census Bureau Web site. Students record their data in a chart and bar graph. Learners also use the website to...
Curated OER
Grade 3 Mixed Math Practice- Mars, X
For this grade 3 mixed math worksheet, 3rd graders complete 9 problems. They work with fractions, nets, line segments, elapsed time, and a data table. They draw the bar graph to go with the data, and practice mental multiplication.
Curated OER
Chemistry Review
In this chemistry review worksheet, students read about atoms and the periodic table and they complete a chart using the periodic table to find the atomic number, atomic mass and group of given elements. Students answer 5 questions about...


