Curated OER
Air Pollution:What's the Solution?-Weather's Role
In this air pollution and weather worksheet, learners collect data using an online animation to determine the air quality at given times along with the wind speed and temperature in a particular city. Students make 3 bar graphs using the...
Curated OER
Stick Out Your Tongue
Students explore their sense of taste and recognize good foods to eat. In this tasting lesson plan, students recognize that their tongue has taste buds for different types of tastes. Students create a bar graph showing their favorite...
Curated OER
Wolves
Students explore wolves. In this ecology and wolves lesson, students research predator-prey relationships on the Internet and complete a related worksheet with a partner. Students interpret data on bar graphs to determine growth and...
Curated OER
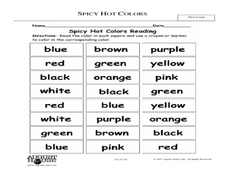
Spicy, Hot Colors
Students demonstrate an understanding of colors. In this visual arts lesson, students read the text Hot, Spicy Colors and name their favorite colors. Students complete a bar graph to show the data. Students discuss how each color can...
Curated OER
Livelihood of the Times
Learners recognize the importance of analyzing historical information and data. In this historical analysis lesson, students collect information for a bar graph, complete a jobs worksheet and define vocabulary.
Curated OER
Comparing And Ordering Decimals
In this decimals worksheet, students compare and order decimals using comparing symbols, ordering from least to greatest, answering word problems, and deciphering a bar graph. A very nice resource.
Curated OER
Spreadsheet Graphs
Students create graphs using information from spreadsheets. They select a topic from the following choices: website use, digital cameras, spreadsheets, calculators or educational software. They tally the class results and create an...
Curated OER
Meet The Graphs
Learners identify two types of graphs. They analyze and interpret authentic data shown in bar and pie graphs and complete a graph given specific data. Perform simple functions within an Excel document:
Curated OER
And Around We Go!
Sixth graders conduct a survey and collect data to construct a bar graph that will then be changed into a circle graph. With the bar graph, 6th graders compare estimated fractions and percentages and estimate percentages. With the circle...
Curated OER
How Do You Spend Your Time?
Pupils keep records and determine how much time they spend on certain activities. They insert the data into a spreadsheet. Students graphically display data in a bar graph and a circle graph.
Curated OER
"Favorite Fairy Tale Characters"
Third graders enter the results of their survey on a spreadsheet. They construct a bar graph showing the results.
Curated OER
Creating a Bar Graph Using a Spreadsheet: Dice Rolling Probabilities
Tenth graders explore the concept of spreadsheets. They create a simple spreadsheet and chart from given data. Students perform basic formatting procedures on their chart. They use spreadsheet functions to perform calculations.
Curated OER
The Average Kid
Learners determine the traits they have in common with other students in the class and create visual profiles of the "average" boy and the "average" girl.
Del Mar College
Finding the Domain
Domain to a math teacher makes perfect sense, but it can seem like gibberish to high schoolers. As it is laid out in clear terms, domain is introduced and explained among all types of functions throughout the handout. The first three...
Curated OER
Living in the Desert
Conduct an investigation on the plants used by the Hohokam tribe. To survive in the harsh desert environment the Hohokam used many natural resources. Learners read, research, map, and graph multiple aspects of Hohokam plant use as a...
Cornell University
Garden Math
Young scientists must put their math caps on and figure out what fraction of each flower is in a raised flower bed. They must problem solve to simplify the fractions, and then graph the amount of flowers that are in different flower beds.
Curated OER
Mathematics Module
Delve into graphing! The concepts covered begin with basic graphing basic coordinates and algebraic expressions on coordinate planes, and build up to graphing linear inequalities and equations. Learners solve and simplify various...
Curated OER
Do new kinds of insects appear after soil modification?
Students explore and experiment with the concept do new kinds of insects appear after soil modification. They assess and review scientific methods of observation, predicting, variables, math skills, ratio, proportions, graphs and the art...
Curated OER
Introduction to the National Debt
Students relate the national debt to the economy. In this algebra lesson, students discuss what the national debt is, create a national budget based on priority and what the government should spend money on. They analyze their findings...
Curated OER
Archaeology Vocabulary Sampling
Students predict how many words out of ten they accurately define. They match the definitions to the correct vocabulary words and make a bar graph showing how many definitions were matched to the correct words. The write their group...
Curated OER
The Immigrants of Brooklyn: Now And Then
Students compare the immigrant population during the pre-Civil War era (1855) to that of today (2000 census data). They interpret circle and bar graphs comparing immigrant populations in Brooklyn yesterday and today, and create a class...
K12 Reader
Displaying Data
It's important to learn how to display data to make the information easier for people to understand. A reading activity prompts kids to use context clues to answer five comprehension questions after reading several paragraphs about...
Curated OER
Light Plants and Dark Plants, Wet Plants and Dry Ones
Young scholars plant sunflower seeds in plastic cups, and once germinated, these are exposed to different conditions of light levels and/or soil moisture contents. Students measure growth of the seedlings every few days using...
Curated OER
Pumpkin Play
Have you ever examined a pumpkin and estimated the number of lines it has? In this math lesson, students count the actual number of lines, record and graph the results. They investigate the circumference, weight and buoyancy of the...


