Noyce Foundation
Granny’s Balloon Trip
Take flight with a fun activity focused on graphing data on a coordinate plane. As learners study the data for Granny's hot-air balloon trip, including the time of day and the distance of the balloon from the ground, they practice...
Bridges In Mathematics
Grade 2 Comprehensive Growth Assessment
Need to know if your students comprehend all the Common Core standards covered in second grade? This growth assessment will let you know. Find out if your second graders can add/subtract, tell the time, read a bar graph, know their...
Curated OER
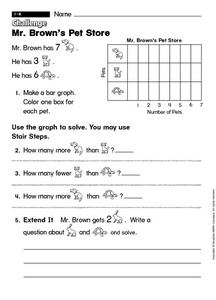
Mr. Brown's Pet Store
In this early childhood problem solving activity, students make a bar graph with the provided information and then use the graph to solve 4 problems.
Curated OER
U.S. Beach Attendance
In this bar graphs worksheet, students analyze the information about beach attendance over a period of 5 years. Students solve 3 story problems about the graph.
Georgia Department of Education
The Basketball Star
Have learners use math to prove they are sports stars! Assess a pupil's ability to create and analyze data using a variety of graphs. The class will be motivated by the association of math and basketball data.
Math Learning Center
Fourth Grade Assessments and Scoring Checklists, Common Core State Standards
Find out how your class is progressing in math with a set of assessments. Learners finish a baseline assignment to assess where they are beginning the year and then work on tests with increasing difficulty as the year progresses.
Curated OER
Data Handling
In this data handling worksheet, 6th graders solve and complete 4 various types of problems. First, they draw a bar chart to represent the information provided in the table shown. Then, students show beneath the table how to work out the...
Curated OER
Histograms
In this histograms worksheet, students solve 5 word problems based on a histogram of presidential ages at their inauguration. Next, students create a frequency table and a histogram based on a list of data which shows the average...
Curated OER
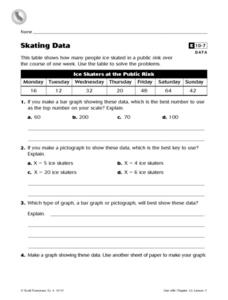
Skating Data
In this collecting data activity, 4th graders view a table on ice skaters at a public rink in order to answer 2 multiple choice questions, 1 short answer question and make a graph showing one piece of the data.
Curated OER
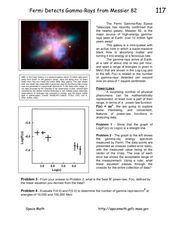
Fermi Detects Gamma-Rays from Messier
For this power law function worksheet, students use data from the Fermi Gamma-Ray Space telescope to apply the power law function to physical phenomena. Students use a graph to solve four problems.
Curated OER
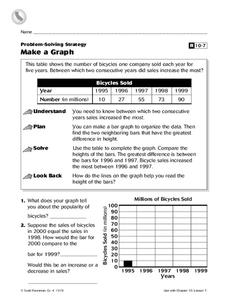
Make a Graph
For this graphs worksheet, 4th graders, after studying and analyzing a table on bicycles sold within several years, answer 2 short answer questions relating to the table.
Curated OER
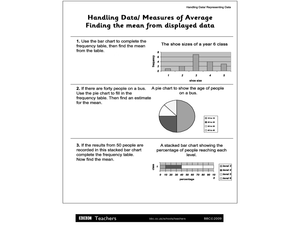
Handling Data/Measures of Average - Finding the Mean from Displayed Data
For this mean and average worksheet, learners use the bars and charts to help them find the means using the given data. Students solve 3 problems.
Noyce Foundation
Ducklings
The class gets their mean and median all in a row with an assessment task that uses a population of ducklings to work with data displays and measures of central tendency. Pupils create a frequency chart and calculate the mean and median....
Curated OER
The Haar Wavelet Filter Bank
In this Haar Wavelet worksheet, learners solve and complete 4 different problems related to the Haar Wavelet filter bank. First, they define the properties of Haar basis. Then, students compute the matrices for the first, second and...
UAF Geophysical Institute
Observing the Weather
How can you predict the weather without any technology? Young scientists learn to forecast the weather using traditional Native American techniques. Based on their observations of the weather, as well as talking to their classmates, they...
Curated OER
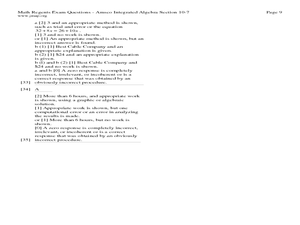
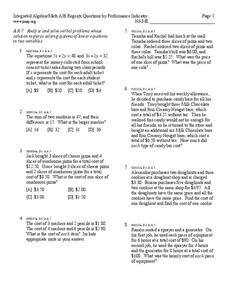
Using Systems of Equations
In this algebra activity, learners solve systems of equations. They use substitution, elimination and graphing to solve. There are 33 questions with an answer key.
Curated OER
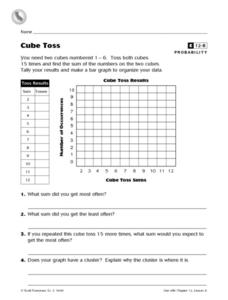
Cube Toss
For this probability and graphing worksheet, students solve 8 problems in which data from a cube toss is displayed on a table and graph. Students answer the questions about their results.
Curated OER
More Students Taking Online Courses
For this graph worksheet, students study a bar graph that shows the number of college students taking at least one online course. Students answer 4 problem solving questions about the data on the graph.
Virginia Department of Education
Normal Distributions
Pupils work to find probabilities by using areas under the normal curve. Groups work to calculate z-scores and solve real-world problems using the empirical rule or tables.
Curated OER
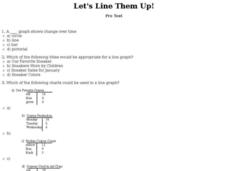
Let's Line Them Up!
In this line graph worksheet, students read through the problems about graphing and line graphs. Students select the best answer to solve the 10 online questions.
Curated OER
Histograms: Homework
In this histograms worksheet, students learn how to make a histogram. Students give graphs a title, draw the axes, label the vertical axis, choose an appropriate scale, and mark equal intervals. Students label the horizontal axis with...
Curated OER
Data Analysis
In this data analysis worksheet, students solve and complete 4 different types of problems. First, they reduce the data provided to find the means, and graph the means in a line graph. Then, students graph the data from each mixture...
Curated OER
Linear Equations
In this algebra worksheet, students solve linear equations and graph their answer. They add and subtract integers and compare them using a number line. There are 15 questions with an answer key.
Georgia Department of Education
Math Class
Young analysts use real (provided) data from a class's test scores to practice using statistical tools. Not only do learners calculate measures of center and spread (including mean, median, deviation, and IQ range), but...


