Virginia Department of Education
Normal Distributions
Pupils work to find probabilities by using areas under the normal curve. Groups work to calculate z-scores and solve real-world problems using the empirical rule or tables.
Curated OER
Studies of the Eastern Worlds: Population Graphing
Seventh graders participate in several learning/research stations in which they view artwork from various countries of the Eastern world and collect information on the populations of the Eastern countries. They then use this information...
Curated OER
Math & Social Science
Students are given data and are to calculate averages and yearly totals of how many cars travel the Tacoma Narrows Bridge. They also make a graph of the data.
Curated OER
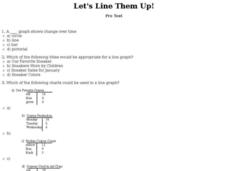
Let's Line Them Up!
For this line graph worksheet, students read through the problems about graphing and line graphs. Students select the best answer to solve the 10 online questions.
Curated OER
Histograms: Homework
In this histograms worksheet, students learn how to make a histogram. Students give graphs a title, draw the axes, label the vertical axis, choose an appropriate scale, and mark equal intervals. Students label the horizontal axis with...
Curated OER
Decode Word Is..
Students solve problems using patterns. In this algebra lesson, students identify the relation, domain and range of a function. They graph functions using coordinate pairs.
Curated OER
Data Analysis
In this data analysis worksheet, pupils solve and complete 4 different types of problems. First, they reduce the data provided to find the means, and graph the means in a line graph. Then, students graph the data from each mixture shown...
Curated OER
Weather, Weather, Everywhere!
Sixth graders collect weather data to compare temperatures around the world. Using the Internet, learners collect data, put it into spreadsheets, and analyze and graph the results. An interesting way to cover the topic of weather.
Curated OER
Mars Landing Site
Pupils, through the use of candy bars at room temperature, explore the problems selecting a landing site on Mars.
Curated OER
School Yard Waste
Fourth graders examine the types of garbage that they collect on the playground. They collect the information in a spreadsheet and create a graph that displays the number of types of trash found. They design and monitor a playground...
Curated OER
Fly Away With Averages
Students discover the process of finding the mean, median, and mode. Through guided practice and problem solving activities, they use a computer program to input data and create a graph. Graph data is used to calculate the mean,...
Curated OER
What's Your Favorite Stuffed Animal?
Second graders gather information in a survey and interpret the results using a tally chart, a table, and a bar graph. They' present their results of the during the final group discussion. The subject of the survey is favorite stuffed...
Curated OER
Parts of a Whole
Fourth graders explore fractions through the analysis of various paintings. They view and discuss paintings by Picasso and Seurat, discuss the fractional examples in the paintings, and create a bar graph.
Curated OER
What is a Tropical Rainforest?
Pupils investigate amounts of rainfall in selected world rainforests by creating a bar graph showing rainfall in inches for each. They convert inches to millimeters, and solve word problems having to do with rainfall in selected world...
Curated OER
Rolling Dice
Fourth graders investigate the mathematical concept of probability. They determine the given mean of a data set found when rolling dice. The results of the experiment are displayed using a bar graph. The teacher does an example before...
Alabama Learning Exchange
Poppin' For Popcorn!
Students graph data from different popcorn flavors. In this graphing lesson, students make graphs using an assigned web site after collecting data about the flavors of popcorn that fellow classmates prefer.
Curated OER
French Fry Fun: Estimating and Measuring
Third graders demonstrate their estimating and measuring abilities. In this length measurement lesson, 3rd graders produce estimates of how long a handful of French fries will be before physically measuring them. Students...
Curated OER
Butterfly Adventure
Students in second grade are paired with fifth grade computer research buddies. They observe the characteristics of caterpillars, and identify the four stages of the caterpillar to butterfly life cycle. They graph the number of...
Curated OER
When Dinosaurs Ruled the World
Students graph the varying sizes of dinosaurs. In this math and dinosaur lesson, students view dinosaur models and compare the different shapes and sizes of the dinosaurs. Students complete a dinosaur math activity, read The...
Curated OER
Jelly Bean Math
Students estimate, measure, compute, and create patterns using jelly beans. In small groups, they solve various calculations, place jelly beans into groups, invent a new flavor, create a pattern, and complete a worksheet.
Curated OER
Friction Flyers
Young scholars explore the principles of magnetism and friction. They complete an interactive puzzle on the Gizmos and Gadgets computer software, construct a vehicle, build and modify ramps and vehicles to produce various outcomes, and...
Curated OER
Marketing Occupations
Students identify and explain the variables effecting supply and demand in the marketing industry. Then they define the terms supply and demand and graph supply and demand curves on a standard grid. Students also formulate what happens...
Curated OER
What Would Make Our School More "Green"?
Students survey their school to get ideas for how to make the school more environmentally friendly. In this environmental lesson, students collect data from other students and teachers. They use the data to create graphs and present a...
Curated OER
Technobiz
Students examine candy preferences to create a plan in order to improve candy sales. In this technobiz instructional activity, students build spreadsheet and organizational skills by graphing and calculating data. Students are introduced...


