Curated OER
Graphs and Measurement
Tenth graders analyze graphs and by comparing trees. In this geometry lesson, 10th graders investigate the use of different graphs using bar and regular graphs. They work groups at the computer.
Curated OER
The Appearance of a Graph
Sixth graders understand that the appearance and increment used on the x and y axis in a graph change how it looks. In this graphing lesson, 6th graders work in pairs and interpret graphs using different axes. Students collect graphs...
Curated OER
Graphing Data
Students graph lines in a coordinate plane. In this geometry lesson, students graph lines on a coordinate plane, and identify the slope. They calculate the volume, area and perimeters of the shapes created on a coordinate plane.
Curated OER
Creating a Graph
Students brainstorm favorite things to do during the summer. They survey classmates to collect data, arrange it in a chart, and create graphs using ClarisWorks.
Curated OER
Freshman Project-Part 5
In this project instructional activity, 9th graders display their data, the make a graph and they answer analysis and conclusion questions on their experimental design project. They discuss the variables of their experiment, their major...
Curated OER
Surveys and Graphing
First graders survey different classrooms to determine types of products students would like to see sold at school, and create graphs based on survey results.
Curated OER
Using Excel To Teach Probability And Graphing
Students engage in the use of technology to investigate the mathematical concepts of probability and graphing. They use the skills of predicting an outcome to come up with reasonable possibilities. Students also practice using a...
Curated OER
Graphing Candy-Coated Chocolates
Learners place pieces of candy on their coordinate graphs as the teacher calls out the colors and coordinates embedded in the plan. The teacher circulates around the class to check each student's answers for accuracy.
Curated OER
No Title
Sixth graders, after reviewing and studying the basics of recording, analyzing and presenting data, create on graph paper a bar or line graph to represent given data and then interpret the data. They answer questions about the given data...
Curated OER
Graphs
In this Cartesian coordinate plane worksheet, students analyze 4 ordered pairs and locate the place that goes with that point on a graph. Students also write the ordered pair for 4 places shown on the graph. Note: One of the places is a...
Curated OER
Foliage Tracker
Young scholars discuss the change of leaf colors and the role that climate and elevation play in those changes. They then track leaf changes, input data, and graph foliage changes with a free online tool.
Curated OER
Using Data To Make Graphs
In this using data to make graphs worksheet, students interactively answer 10 multiple choice questions then click to check their answers.
Curated OER
Apple Graphing
Learners sample a variety of types of apples and then survey each other regarding their favorites. They chart how many students prefer each type of apple.
Curated OER
Parachute Drop
Learners will have fun creating a parachute to collect data with. They will construct the parachute in small groups, measure the materials, and create an observation sheet. Then they drop the parachute and make predictions about how long...
Curated OER
Go The Distance Car Construction
Students build and program a car to drive a specific challenge distance.They must at the end of the instructional activity, have the car that stops the closest to a challenge distance.
Charleston School District
Review Unit 4: Linear Functions
It's time to show what they know! An assessment review concludes a five-part series about linear functions. It covers all concepts featured throughout the unit, including linear equations, graphs, tables, and problem solving.
Curated OER
Graphing Surveys
Students collect data and graph it. In this algebra lesson, students create a survey for their classmates and teachers. They analyze the results from the survey and graph it. They draw conclusion from their data based on the graph.
Curated OER
Fractions of Whole Numbers 1
In this math worksheet, students use line graphs and fraction bars to multiply fractions and whole numbers. The fraction is represented on the line graph and the whole number on the fraction bar.
Curated OER
Bunny Cakes and Graphing
Third graders graph and analyze data relating to the book "Bunny Cakes" by Rosemary Wells. They listen to and discuss the book, vote on their favorite cake using Excel computer software, and discuss the results.
Curated OER
Graphing the Past Using Today's Technology
Eighth graders research statistical data regarding their current social studies unit. They write questions about the measures of central tendency, collect and analyze the data, insert the data into a spreadsheet, and generate graphs.
Curated OER
Get Ready For Some Football
Sixth graders compare and contrast the totals from two national football teams for the year. Using the internet, they search for the information they need and create a data bar graph. They use the information they collected to answer...
Curated OER
How Many?
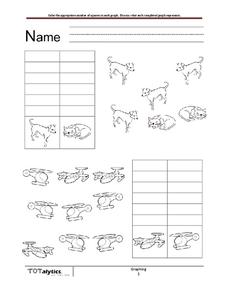
How many cats are there? Dogs? As learners examine a set of images, they fill in a chart to indicate how many of each image there are. In the first series, there are four dogs and two cats. In the second, there are three planes and six...
Curated OER
Rain Forests: A Disappearing Act?
Students examine and locate rainforests on maps, and research the patterns of their destruction. They develop a bar graph of rainfall and temperature data, write a journal entry, and research the people, animals, and plants/products of...
Curated OER
Tree Measurement
Measure a tree? Yes, measure a tree! Students get outside and measure a tree's trunk, crown, and height. Each group compares their answers to determine if any re-measuring is necessary. Once back in the classroom, students make bar...
Other popular searches
- Skittles Bar Graph
- Double Bar Graphs
- Bar Graphs Pictographs
- Histogram and Bar Graph
- Bar Graphs and Histograms
- Bar Graph Problem Solving
- Favorite Food Bar Graph
- Bar Graphs Histograms
- Interpreting Bar Graphs
- Bar Graphs for Birthdays
- Bar Graph Worksheet
- Bar Graphs and Charts


