Cuemath
Cuemath: Data Handling
This comprehensive guide about data handling helps with understanding how the study of data handling and graphical representation of the data along with other tools help us in dealing with numerical data. Includes solved examples and...
E-learning for Kids
E Learning for Kids: Math: Tea Store: Reading a Table
Students will demonstrate how to interpret information in a table.
Discovery Education
Discovery Education: Science Fair Central: Investigation Set Up and Collect Data
A brief overview of how to gather both quantitative and qualitative data, complete with a sample data table.
Pew Research Center
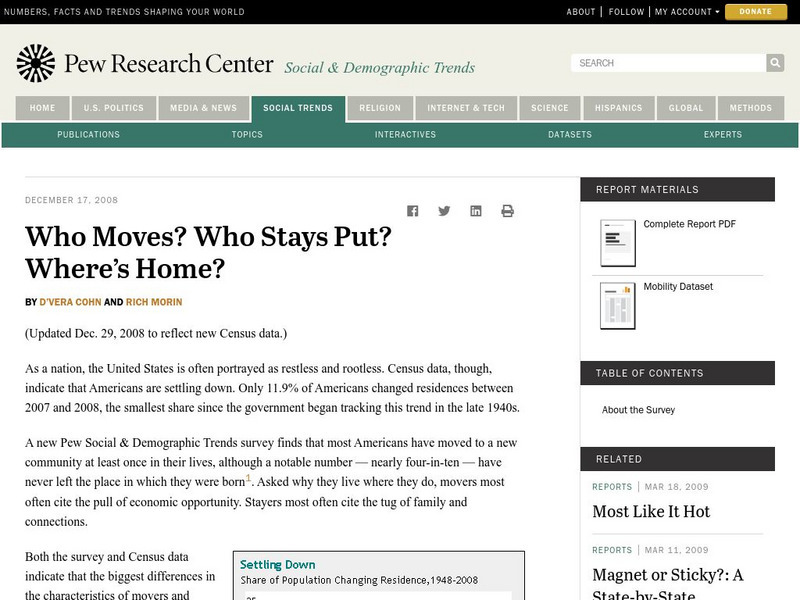
Pew Social and Demographic Trends: Migration Flows in the United States
The Pew Hispanic Research Center details the migration flows of the United States. Breaks down U.S. migration patterns from the last 20 years. Scroll mouse over map to see the regional migration throughout the years. View a map which...
Other
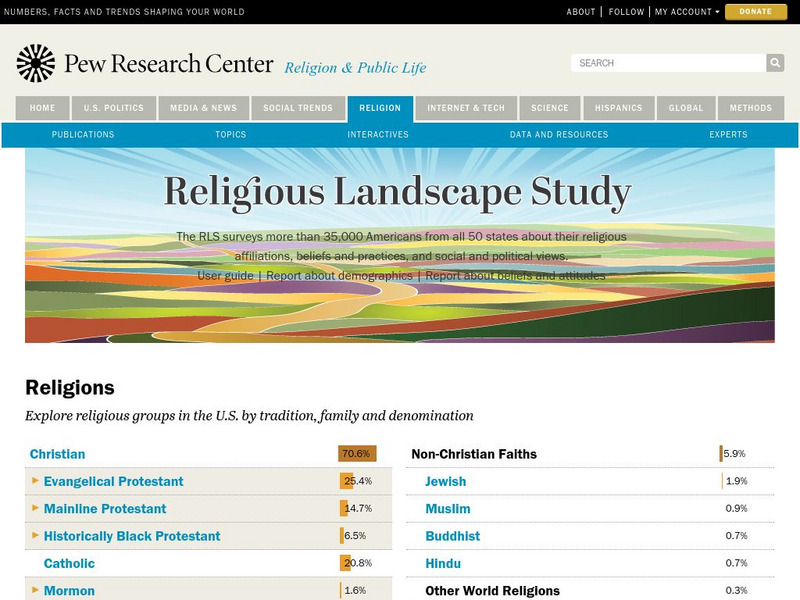
Pew Forum on Religion and Public Life: u.s. Religion Landscape Survey
Website summarizing the results of a survey on religion in the U.S. Contains maps and charts of information for each specific religion as well as bar graphs comparing the deomographics of the different religious groups. Two full reports...
abcteach
Abcteach: Dinosaurs
[Free Registration/Login Required] This resource features a variety of activities related to dinosaurs. There are interdisciplinary tasks that include writing exercises such as creative writing and story planner formats. Lessons for...
Teachnology
Teachnology: Survey Teaching Theme
Survey Theme provides an excellent collection of free sample worksheets, teacher resources, lesson plans and interactive media for grades k-12.
Teachnology
Teachnology: Survey Teaching Theme
Survey Theme provides an excellent collection of free sample worksheets, teacher resources, lesson plans and interactive media for grades k-12.
Texas Instruments
Texas Instruments: Taste Test
Students collect sample data and use the calculator to create pictographs, bar graphs, and pie graphs to demonstrate the favorite brand in the sample data.
US Department of Energy
United States Department of Energy: Power Metering Project
Two part instructional activity focuses on applying analytic tools such as pie charts and bar graphs to gain a better understanding of practical energy use issues. Students will learn how different types of data collected affect the...
US Geological Survey
Usgs: Water Science for Schools Uses of Saline Water
This U.S. Geological Survey website explains a variety of uses for saline water. Pie graphs and bar graphs are used to illustrate the various uses. Click Home to access the site in Spanish.
The Math League
The Math League: Ratio and Proportion
This tutorial provides definitions and examples of ratios and proportions and features comparing ratios and converting rates.
Khan Academy
Khan Academy: Read Histograms
Practice reading and interpreting histograms. Students receive immediate feedback and have the opportunity to try questions repeatedly, watch a video or receive hints.
Texas Instruments
Texas Instruments: Stretching Slinkies
This lesson provides students with the opportunity to explore the TI-84 graphing calculator in conjunction with Microsoft Excel. Students can use the "Stretching Slinkies" worksheet to record and enter data. They will either: enter data...
Other
Stat Soft: Statistics Glossary
Dozens of statistical terms are defined and illustrated in this glossary.


