Curated OER
The Gathering and Analysis of Data
Young mathematicians gather data on a topic, graph it in various forms, interpret the information, and write a summary of the data. They present their data and graphs to the class.
Curated OER
Survey Say...
Students examine a variety of charts and graphs that present data in a format that is easy to read. They work in groups to conduct a survey amongst their classmates. The data collected from the survey is then put on a bar graph.
Curated OER
Introduction to the National Debt
Students relate the national debt to the economy. In this algebra lesson, students discuss what the national debt is, create a national budget based on priority and what the government should spend money on. They analyze their findings...
ARKive
Handling Data: African Animal Maths
Handling and processing data is a big part of what real scientists do. Provide a way for your learners to explore graphs and data related to the animals that live on the African savannah. They begin their analysis by discussing what they...
Curated OER
M&Ms Count and Crunch
Middle schoolers practice skills involving statistics and probability by making predictions on number of each color candy in one pound bag of M&Ms. They record both guesses and actual quantities, calculate percentages, and create bar...
Sharp School
Geography Project
This very simple geography project can lead to a lot of useful referential information that can be displayed in your classroom! Learners construct a poster-size map of a country, identifying major demographic points and including pie/bar...
Curated OER
Graphing Favorite Holidays
Students create spreadsheets and bar graphs based on results of survey of favorite holidays.
Curated OER
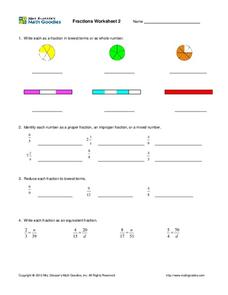
Fractions: pie graphs, numbers, and bars
In this fraction worksheet, middle schoolers complete fraction problems containing pie graphs, numbers, bars, proper fractions, lowest terms, and more. Students complete 19 problems.
Curated OER
Investigating: Interpreting Graphs and Analyzing Data
Students explore statistics by researching class birthday data. In this data analysis lesson, students investigate the different birthdays among their classmates and create data tables based on the given information. Students view bar...
Curated OER
Meet The Graphs
Students identify two types of graphs. They analyze and interpret authentic data shown in bar and pie graphs and complete a graph given specific data. Perform simple functions within an Excel document:
Curated OER
Getting Graphs: Researching Genealogy-A Piece of Pie
Third graders research their genealogy. In this math lesson, 3rd graders collect data and create graphs and charts. A presentation of their findings is given.
Curated OER
What Are We Listening To?
Students gather data from a web site on number of music albums sold by genre for the last two years. They convert these figures to fractions, decimals, and percents, and display the results in bar graphs and pie charts.
Curated OER
Local Traffic Survey
Young scholars conduct a traffic survey and interpret their data and use graphs and charts to display their results.
Curated OER
Data Handling
In this data handling worksheet, 6th graders solve and complete 4 various types of problems. First, they draw a bar chart to represent the information provided in the table shown. Then, students show beneath the table how to work out the...
Curated OER
Data Handling
In this data handling worksheet, students explore multiple ways to represent data. They create stem and leaf plots, histograms, and bar charts. Students examine and interpret diagrams and statistics. This eleven-page worksheet...
Curated OER
Twelve Days of Christmas--Prediction, Estimation, Addition, Table and Chart
Scholars explore graphing. They will listen to and sing "The Twelve Days of Christmas" and estimate how many gifts were mentioned in the song. Then complete a data chart representing each gift given in the song. They also construct...
Curated OER
Historical Population Changes in the US
Students conduct research on historical population changes in the U.S. They conduct Internet research on the Historical Census Data Browser, create a bar graph and data table using a spreadsheet program, and display and interpret their...
Curated OER
Activity: An Experiment with Dice
Roll the dice with this activity and teach young mathematicians about probability. Record outcomes for rolling two number cubes in order to determine what is most likely to happen. Graph the data and investigate patterns in the results,...
Howard Hughes Medical Institute
Color Variation Over Time in Rock Pocket Mouse Populations
While many mutations are neutral, those that appear advantageous increase in frequency in a population. Scholars use illustrations to make predictions about populations of mice. They follow it up with a video to confirm or refute their...
Curated OER
A Plop and Fizz
Seventh graders perform an experiment to determine the effect of temperature on reaction rates. In this chemistry lesson, 7th graders take measurements and record data. They create a graph and analyze results.
Curated OER
Data Display
Students explore different ways to display data. In this statistics lesson plan, students create pie charts, bar graphs and line graphs to show data. Students then write a paragraph discussing which types of graphs are helpful for...
Curated OER
Graphing Our Favorite Candy Bars
Students use ClarisWorks to graph class' favorite candy bars on a bar graph.
Curated OER
A Bar of Many Colors
Second graders use colored candies to collect data, construct double bar graphs, and find averages.
Curated OER
C is for Cookie-A MEAN-ingful Graphing Activity
Third graders, in groups, dissect a variety of brands of chocolate chip cookies and calculate the mean for each brand. They create their own bar graphs, pictographs, and line graphs to represent information.


