Curated OER
Jelly Bean's Galore
Young scholars investigate the origins of the Jelly Bean. They complete a Scavenger Hunt using the jellybean website. Pupils create a bar graph using information collected about jelly beans. Students discuss the time of year that Jelly...
Curated OER
A Class Census
Students recognize that data represents specific pieces of information about real-world activities, such as the census. In this census activity, students take a class and school-wide census and construct tally charts and bar graphs to...
Curated OER
Data Analysis and Probability Race to the Finish
Students practice addition facts, record data, and construct a bar graph. In this probability lesson, students participate in a board game in which bicycles move towards a finish line based on players completing addition problems. Dice...
Curated OER
Show Me!
Students analyze and interpret graphs. In this graphing lesson, students view a video and construct their own graphs (line, circle, bar) from given sets of data.
Curated OER
Pictures of Data: Post Test
In this data worksheet, students answer multiple choice questions about charts and graphs. Students answer 10 questions total.
Curated OER
Pictures of Data
In this data worksheet, students look at maps and charts and answer multiple choice questions about them. Students complete 10 questions.
Curated OER
French Fry Run
Student explore estimation and measurement. In this measurement lesson, 2nd graders measure french fries, graph their data, and determine the size of french fries that is the best value. Students practice how to add prices and calculate ...
Curated OER
The Snack Bar
Sixth graders complete a purchase order. In this ratios and patterns lesson, 6th graders work in groups to complete a purchase order for a grand opening of the school snack bar. Students use rations to figure out the need and quantity...
Curated OER
A Thanksgiving Survey
Students take a survey then use the information gained from the survey to help plan a typical Thanksgiving dinner for our last day of class. They create a graph which corresponds the the data gathered during interviews.
Curated OER
Counting
Second graders comprehend how to use two different kinds of graphs. They complete a worksheet with the help of the teacher and a bag of jellybeans and then another worksheet without the direction of the teacher. Students listen as the...
Bowland
Mystery Tours – Plan Your Tour
Everyone loves a vacation and a set of three activities has groups planning a tour of the U.K. using given distance, time, and price data. They solve a variety of problems related to the trip and produce a report on the success of the trip.
Curated OER
Graphs Abound
Young scholars create a survey for their classmates to collect data on their favorite foods, eye color, pets or other categorical data. They compile the data from the survey in a table and then make a bar graph of each category using a...
Curated OER
Graph Your Foot!
Students measure their own foot and place the outline on a graph. They make connections between the size of their foot and the bar graph that represents it.
Curated OER
Candy Bar Survey
Second graders investigate the skill of graphing data by using candy bars to create context for the lesson. They use technology for graphing and organizing information like a spreadsheet. The lesson includes a resource link to aid in the...
Curated OER
Graphs Galore
Fourth graders conduct surveys to collect data. They analyze and interpret the data, then determine which type of graph is appropriate for the data. Students use the data to make predictions, discover patterns and draw conclusions...
Curated OER
Using Charts and Graphs to Study East Asia's Modern Economy
Students examine East Asia's modern economy. In groups, classmates use the internet to compare the resources, products, and economy of specified countries. After collecting the data, pupils create charts, tables and graphs. They...
Curated OER
Creating Line Graphs
Learners draw line graphs. For this math lesson, students interpret minimum wage data and graph the data in a line graph. Learners predict the next minimum wage and figure the earnings for a 40 hour work week for someone earning the...
Curated OER
Weather Graphs
First graders use their knowledge of weather symbols to organize and construct a graph of the daily weather for one month. Each student have a chance to give the daily weather report using Sammy's Science House Computer Software.
Curated OER
Graphing a Healthy Lifestyle
Fifth graders, over a week, record the amount of time they spend sleeping, attending school, watching T.V., exercising and doing homework. At the end of the week the students graph all of their information and discuss how sleep impacts...
Curated OER
Quarter, Nickel, Dime....
An engaging game called, "Quarter, Nickel, and Dime" is presented in this math lesson. Players are given an envelope with slips of paper that represent the three coins. In pairs, they play the game 18 times, and the whole class charts...
Made by Educators
Sociological Methods
First year undergraduate sociology students can prepare for their exams with an application that provides practice questions in six categories: Quantitative and Qualitative Data, Sources of Data, Primary and Secondary Data, Positivism...
Curated OER
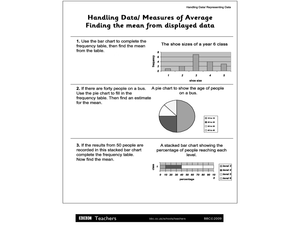
Handling Data/Measures of Average - Finding the Mean from Displayed Data
In this mean and average worksheet, students use the bars and charts to help them find the means using the given data. Students solve 3 problems.
Curated OER
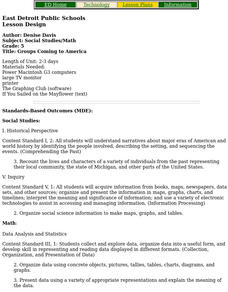
Groups Coming to America
Fifth graders use text or other references to locate different types of information about the Mayflower and pilgrims. They create a presentation for lower elementary classes about the Pilgrims.


