Curated OER
Definition and Applications of Computational Science
Students participate in a variety of instructional experiences about Computer Science. They define Computational Science and describe computational simulation. They also compare and contrast Computational Science and Computer Science.
Curated OER
Comparison of Snow Cover on Different Continents
Students use the Live Access Server (LAS) to form maps and a numerical text file of snow cover for each continent on a particular date. They analyze the data for each map and corresponding text file to determine an estimate of snow cover...
McGraw Hill
Glencoe: Self Check Quizzes 2 Using Bar Graphs and Histograms
Use Glencoe's Math Course 2 randomly generated self-checking quiz to test your knowledge of Bar Graphs and Histograms. Each question has a "Hint" link to help. Choose the correct answer for each problem. At the bottom of the page click...
Shodor Education Foundation
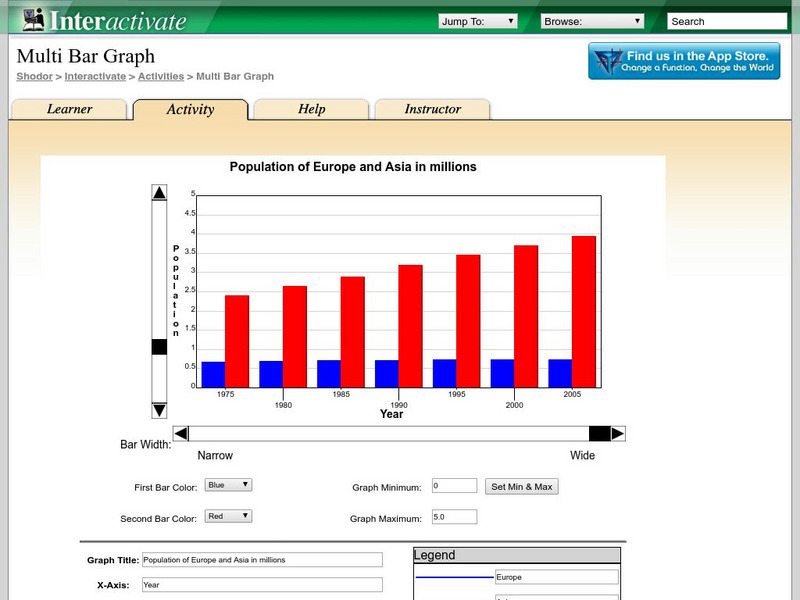
Shodor Interactivate: Multi Bar Graph
The interactive learning activity allows students to manipulate a double bar graph. Teacher resources are included.
Math Is Fun
Math Is Fun: Histograms
Explains, with examples, what a histogram is, how it differs from a bar graph, and how to interpret one. Includes a set of practice questions.
Shodor Education Foundation
Shodor Interactivate: Misleading Graphs
This lesson will challenge young scholars to think creatively by having them design and build water balloon catchers from random scrap materials, while requiring them to take into consideration a multitude of variables including cost,...
Shodor Education Foundation
Shodor Interactivate: Lesson: Histograms and Bar Graphs
This site provides information on Histograms and Bar Graphs. It includes worksheets, key terms, and links to further information.
Khan Academy
Khan Academy: Read Histograms
Practice reading and interpreting histograms. Students receive immediate feedback and have the opportunity to try questions repeatedly, watch a video or receive hints.
ClassFlow
Class Flow: Data Analysis Using Graphing
[Free Registration/Login Required] This flipchart allows students to analyze data using appropriate graphs, including pictographs, histograms, bar graphs, line graphs, circle graphs, and line plots introduced earlier, and using...
Other
Online Statistics Education: Graphing Distributions [Pdf]
This is the second chapter of a statistics e-text developed collaboratively by Rice University, University of Houston Clear Lake, and Tufts University. It looks at many different types of data displays and the advantages and...
Beacon Learning Center
Beacon Learning Center: Kinds of Graphs
An interactive web lesson introduces five types of graphs to students and allows them to practice matching the names to examples.
Khan Academy
Khan Academy: Histograms Review
A histogram displays numerical data by grouping data into "bins" of equal width. Each bin is plotted as a bar whose height corresponds to how many data points are in that bin.
National Council of Teachers of Mathematics
Nctm: Illuminations: State Names
Students use multiple representations to display how many times the letters of the alphabet is used in a state name. Concepts explored: stem and leaf, box and whisker plots, histograms.
ClassFlow
Class Flow: Graphs
[Free Registration/Login Required] This flipchart presents bar and double bar graphs, line and double line graphs, pictographs, histograms, and circle graphs with review activities and web links for practice.
CK-12 Foundation
Ck 12: Types of Data Representation: Graphic Displays of Data
[Free Registration/Login may be required to access all resource tools.] Here you will explore displays of data using bar charts, histograms, pie charts and boxplots, and learn about the differences and similarities between them and how...
Texas Education Agency
Texas Gateway: Selecting and Using Representations for Collected Data
[Accessible by TX Educators. Free Registration/Login Required] Given a variety of data (including line plots, line graphs, stem and leaf plots, circle graphs, bar graphs, box and whisker plots, histograms, and Venn diagrams), the student...
Wolfram Research
Wolfram Math World: Frequency Distribution
This site from MathWorld provides a general overview of frequency distribution, complete with a bar graph and explanatory text.
Texas Instruments
Texas Instruments: Beverage Tests
In this activity, students determine the pH of liquid samples. They get familiar with the pH scale, create graphs comparing pH levels, and compare data displayed as a scatter plot, a boxplot, a histogram, and a bar graph.
Purple Math
Purplemath: Stem and Leaf Plots
Explains how to create a stem-and-leaf plot from a data set. Demonstrates how to format a clear stem-and-leaf plot.
Other
Stat Soft: Statistics Glossary
Dozens of statistical terms are defined and illustrated in this glossary.


