Balanced Assessment
Cost of Living
Math scholars investigate the cost of living in Hong Kong compared to Chicago but must first convert the different types of currency. They then choose a type of graph to compare different spending categories and finish the activity by...
Curated OER
Statistics for Graphing
Students use the Internet to access a variety of websites that present statistics and information for use in graphing. They represent sports statistics, geographical measurements, temperatures and more.
Curated OER
Usage and Interpretation of Graphs
Students explore graphing. For this graphing lesson, students predict how many shoe eyelets are present in the classroom. Students count eyelets and work in groups to organize and chart the data collected. Students put all the data...
Curated OER
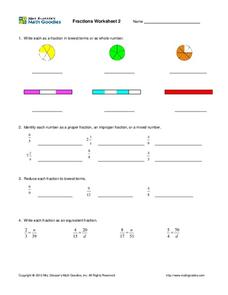
Fractions: pie graphs, numbers, and bars
In this fraction worksheet, students complete fraction problems containing pie graphs, numbers, bars, proper fractions, lowest terms, and more. Students complete 19 problems.
Curated OER
Introduction to Graphs: Bar Graphs, Line Graphs, Circle Graphs
In this graphing data worksheet, middle schoolers answer 5 short answer questions about graphs. Students determine which type of graph best represents various data sets.
Curated OER
Apple Adjectives
Study different apple varieties and use appropriate adjectives to describe them. Learners alphabetize both the apple names and the adjectives before creating spreadsheet, bar, and pie graphs. A mix of language arts, technology, and...
Curated OER
Charting and Graphing Sales
Students analyze and represent weekly sales figures using tables, bar graphs, and pie charts. They draw conclusions using bar graphs and pie charts. Students are told that each day at school they have the option of buying or bringing a...
Curated OER
Students Favorites
Pupils complete activities using a frequency table and construct a pie graph for the data. In this frequency table activity, students complete a survey to find data for a frequency table. Pupils use the given link to make a pie graph...
Curated OER
Favorite Food
Students are given three choices of food. They then decide on their favorite and predict what the class's favorite food will be. After the teacher enters the data into the computer, students gather around the computer to view the...
Curated OER
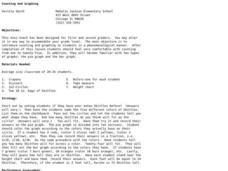
Counting And Graphing
Students explore counting and graphing. In this math lesson plan, students practice counting from 1-25 and are exposed to two types of graphs: the pie graph and the bar graph. Students use Skittles to represent a variety of measurements.
Curated OER
Graphing Using Cookies
Students differentiate between bar graphs, line graphs, pictographs and bar graphs. After participating in a hands-on cookie activity, students label and draw their own graphs.
Curated OER
Graph Made Easy: Post Test
In this graphs worksheet, students answer multiple choice questions about line graphs and bar graphs. Students answer 10 questions total.
Curated OER
Counting Candies
Students count, sort, and classify jellybeans by color. They use their data to create a bar graph. Students are given a small bag of jellybeans, and a worksheet on Counting Candies Tally Chart. They work in small groups. Students are...
Curated OER
Dealing With Data
Students collect, organize, and display data using a bar graph, line graph, pie graph, or picture graph. They write a summary describing the data represented and compare the graph to another graph in the class.
Curated OER
Which Graph is best?
Students use commercial software to organize and visually display data to draw conclusions; students use graphing software to create several types of graphs illustrating the number of each color of M&M's in one bag.
Curated OER
Science: Teddy Bear Nation
Students sort teddy bears according to types and then graph the results. They each bring a bear to class and then discuss their similarities and differences. Once the bears have been sorted into groups according to size and color,...
Curated OER
Bar Graphs and Pie Charts
Students graph data they collected and analyze it using a bar graph. For this algebra lesson, students analyze their data using pie charts and bar graphs while explaining the meaning to each other. They compare and contrast bar...
Curated OER
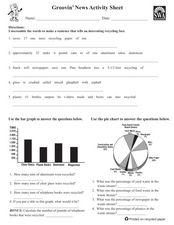
Groovin' News Activity Sheet
In these recycling worksheets, students complete several activities to learn about recycling. Students complete a word search, word scramble, bar graph, pie chart, research project, class project, and individual project for recycling.
Curated OER
Creating Bar Graphs and Pie Graphs
Second graders observe a demonstration of the creation of a bar graph and a pie graph of their favorite colors. They gather information about various topics from their classmates, then organize the information, creating a bar and a pie...
Curated OER
Graphing Favorite Fruit
Third graders take poll and sort data, enter the data to create a spreadsheet and create bar and pie graphs.
Virginia Department of Education
May I Have Fries with That?
Not all pie graphs are about pies. The class conducts a survey on favorite fast food categories in a lesson on data representation. Pupils use the results to create a circle graph.
Curated OER
Australian Settlers
Young scholars interpret graphs and research events to identify links between events in the world and the arrival and plight of immigrant groups. They discuss the myths about immigration.
Math Moves U
Collecting and Working with Data
Add to your collection of math resources with this extensive series of data analysis worksheets. Whether your teaching how to use frequency tables and tally charts to collect and organize data, or introducing young...
Curated OER
Data Collection and Presentation
Middle and high schoolers collect and analyze data from four different activities. The activities include information about classmates, tallying colors of cars in a parking lot, stem and leaf plots, and making a histogram from...


