Curated OER
The Guise of a Graph Gumshoe
Eighth graders practice constructing bar, circle, and box-and-whisker graphs. They practice reading and interpreting data displays and explore how different displays of data can lead to different interpretations.
Curated OER
Opening the Case
Students participate in a class survey and then design an experiment and use graphs and statistics to assist them in solving a problem. They organize the results of the survey in a stem-and-leaf plot and find the range, median, mean, and...
Curated OER
Graphing
Fifth graders create graphs based on climate in South Carolina. They read and interpret information in a chart and construct a graphy from the information in the chart. They create a spreadsheet using Excel and publish 2 graphs.
Curated OER
Interpreting Medical Data
Students explore human anatomy by graphing scientific data. In this vision lesson, students discuss how ophthalmology works and take their own eye assessment test using the Snellen chart. Students collect vision data from all of their...
Curated OER
How's The Weather?
Students make a box and whiskers plot using the TI-73 graphing calculator. Each student would have their own calculator but they would work in small groups of two or three to help each other enter the data and make the plots.
Curated OER
After the Garbage Can: Where Does Our Trash Go?
Learners explore how waste disposal has changed over time and what the current issues are. In this disposal instructional activity students collect data and create graphs.
Curated OER
State Names: Frequency
Data grathers determine the frequency of specified data. They identify the frequency that specified letters occur in the names of all 50 states. They create stem-and-leaf plots, box-and-whisket plots and historgrams to illustrate the data.
Curated OER
Rolling with Links
First graders explore geometry by completing a worksheet in class. In this non-standard measurement unit lesson, 1st graders discuss different techniques for measuring items without the use of a ruler. Students read several short stories...
Curated OER
MAISA and the REMC Association of Michigan
Students complete online research to study geography's impact on weather. In this geography and weather lesson, students research weather in their city for ten days using an online website. Students bookmark the site, enter data into a...
Curated OER
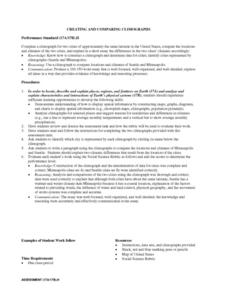
Creating and Comparing Climographs
Students are introduced to the importance and usefulness of climographs. In groups, they create a climograph of two cities on about the same latitude. They compare and contrast the locations and climates of the two cities and write a...
Curated OER
Clouds
Students explore basic cloud types and the weather associated with each one. In this earth science lesson, students participate in numerous activities including going outside to observe the clouds they see, making a cloud in a jar,...
Curated OER
Black History Project
Third graders explore and analyze about famous African-Americans by listening to four picture book biographies. They generate a list of 15 famous African-Americans and then create a survey to rank them according to importance of...
Curated OER
Weather in Your City
Students observe weather conditions of a particular city. Multiple intelligences are explored within this lesson. They locate their particular city on a United States map. Each student writes about their discoveries in his/her journal...
Curated OER
Involving Community Members, Parents, and Community Agencies in Student Learning
Students predict and estimate the number of moose shot by people between the years of 1986-1990. They analyze data and statistics, construct bar graphs, and conduct research on the Alaskan moose.
Curated OER
"Favorite Fairy Tale Characters"
Third graders enter the results of their survey on a spreadsheet. They construct a bar graph showing the results.
Curated OER
Driving Forces Forestry In Canada
Students discuss the natural and economic impact of forests and forestry. Using given statistics they construct different types of graphs in which they make observations and draw conclusions.
Alabama Learning Exchange
Keep It Movin'!
Learners conduct an experiment to study friction. They complete a KWL chart on friction and conduct an activity about the amount of friction on a moving object. To conclude, pupils create a table or graph of the data collected and they...
Curated OER
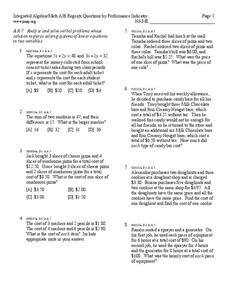
Inequalitities Mixed Review
Students solve inequalities and graph it on a number line. For this algebra lesson, students rewrite word problems into algebraic equations and graph it using compound inequalities.
Curated OER
Linear Equations
In this algebra activity, students solve linear equations and graph their answer. They add and subtract integers and compare them using a number line. There are 15 questions with an answer key.
Curated OER
Pick A Number
Elementary schoolers find out which month has the most class birthdays (mode) and which birthday represents the middle point of all the birthdays (median). They gather and organize data to find one number that fairly represents the whole...
Center for Math and Science Education
Solar System Launch
Trying to understand the vastness of outer space can be quite a challenge for young scientists. Help put things in perspective with this cross-curricular activity as students work in pairs creating scaled models of the solar system,...
Georgia Department of Education
Math Class
Young analysts use real (provided) data from a class's test scores to practice using statistical tools. Not only do learners calculate measures of center and spread (including mean, median, deviation, and IQ range), but also use this...
Math Learning Center
Fourth Grade Assessments and Scoring Checklists, Common Core State Standards
Find out how your class is progressing in math with a set of assessments. Learners finish a baseline assignment to assess where they are beginning the year and then work on tests with increasing difficulty as the year progresses.
Curated OER
Writing Linear Equations
In this math worksheet, learners write the equations in slope intercept form for the equations that are graphed. They also create equations using slope and intercepts.


