Curated OER
Penguin Heights
Young scholars use the worksheet from the first website listed below to collect data on the penguin heights on the Penguin Page.
Curated OER
Phenomenal Weather-Related Statistics
Eighth graders research, collect and interpret data about weather statistics. They record that data on spreadsheets. they create Powerpoint presentations on their individual or group research.
Curated OER
Picture a Nation
Learners research immigration data from a specific time period. They create a graphic organizer that depicts the information and share the information with the class.
Curated OER
Measurement: Using the balance
Students use a balance and gram cubes to measure several different objects. They then record their results on a data chart and answer questions about them.
Curated OER
Plastic Packaging
Students collect data. In this math instructional activity, students collect data about recyclable materials. Students develop a plan that will help the environment. Recycling plastic containers is discussed.
Alabama Learning Exchange
Investigating Friction
Young learners explore friction. They view a video or DVD (bibliography provided) and define terms related to friction, and work in groups to experiment with the effects of friction on speed and motion using ramps and toy cars.
Curated OER
Questionnaires and Analysis
Students, review the techniques and different types of data analysis as well as how they are expressed, identify why facts and data are needed in conclusion of a questionnaire. The concepts of qualitative and quantitative data are...
Curated OER
Whose Breakfast isn't for the Birds?
Students explore coffee production. In this cross-curriculum rainforest ecology lesson, students research regions where coffee comes from and investigate how the native birds in the rainforest are effected by coffee production. ...
Curated OER
A Bird's Eye View of our 50 States
Third graders focus on state birds as they learned absolute location (latitude/longitude) of each state, as well as their relative location (bordering states).
Curated OER
Stock Reports
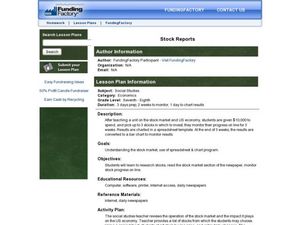
Learners spend $10,000 by picking up to 3 stocks in which to invest. They monitor their progress for three weeks, and chart results in a spreadsheet template.
Curated OER
Age Structure Studies
Students collect data from Internet sources to compare age distributions in their city, county or state with that of other places in the US or other countries. They construct and interpret age-structure population pyramids and research...
abcteach
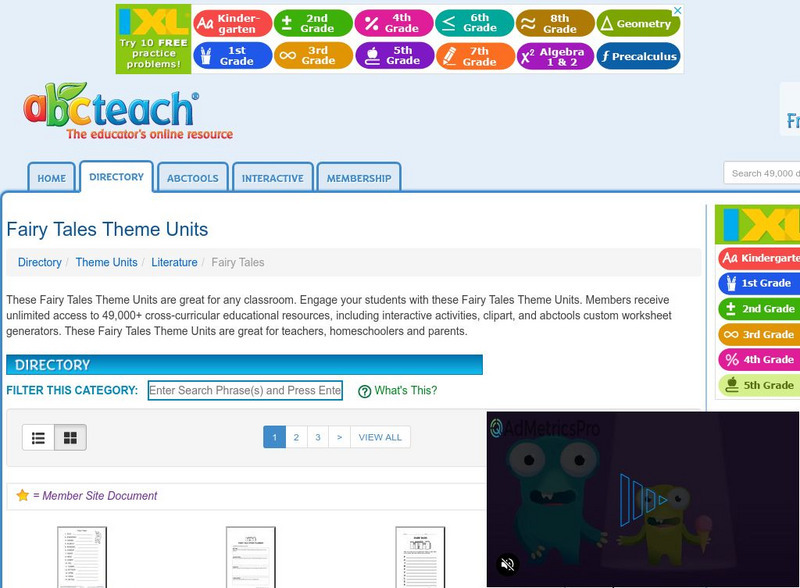
Abcteach: Fairy Tale Printouts: Abc teach.com
[Free Registration/Login Required] This fairy tale resource features activities, bar graphs, word searches, crossword puzzles and more. Teachers can print out many of these materials quickly and easily.
Better Lesson
Better Lesson: Say It With Stats! Review
The students will be working in centers to review for their test. The centers will consist of a computer rotation, versa-tiles, and a teacher center. All centers will reinforce concepts learned throughout this unit to prepare them for...
PBS
Pbs Mathline: Sand Babies (Pdf) [Pdf]
In this engaging activity, students use a variety of measurement strategies in creating their own Sand Babies. Students explore standard and non-standard measurements, area, data collection and analysis, and graphing. Adaptations are...
Other
Stat Soft: Statistics Glossary
Dozens of statistical terms are defined and illustrated in this glossary.


