Curated OER
Data Days
Sixth graders practice collecting, organizing and displaying data. They create circle, bar, line and picto graphs. They analyze data in small and large sample groups.
Curated OER
Let's Graph It
In this let's graph it worksheet, student interactively answer 10 multiple choice questions about graphing data and types of graphs, then click to check their answers.
Curated OER
A Bar of Many Colors
Second graders use colored candies to collect data, construct double bar graphs, and find averages.
Curated OER
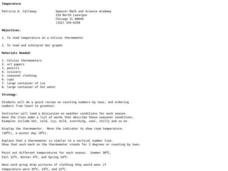
Temperature
Learners explore the concept of temperature. In this temperature lesson, students read thermometers in degrees Celsius. Learners discuss the temperature of the seasons and what clothing they might wear given a certain temperature....
Curated OER
Getting A Grip On Graphs
Fourth graders gather variety of data and create a graphs to display the data.
Curated OER
Problem-Solving Application: Use a Graph
In this problem solving worksheet, 6th graders use the problem solving steps of understand, plan, solve and look back to answer a graphing question.
Curated OER
Using Charts and Graphs to Study East Asia's Modern Economy
Students examine East Asia's modern economy. In groups, classmates use the internet to compare the resources, products, and economy of specified countries. After collecting the data, pupils create charts, tables and graphs. They...
Mixing In Math
Mixing in Math: Growing Plants
Whether you have your class plant seeds or begin when sprouts are visible, math skills are used here to predict and track growth over time. Straw bar graphs show plant height on a given day while the graph as a whole shows changes over...
Curated OER
Water: From Neglect to Respect
The goal of this collection of lessons is to make middle schoolers more aware of the ways in which they are dependent upon water to maintain their standard of living. Learners compare water use in Lesotho to water use in the United...
Curated OER
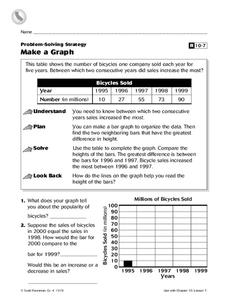
Make a Graph
In this graphs worksheet, 4th graders, after studying and analyzing a table on bicycles sold within several years, answer 2 short answer questions relating to the table.
Curated OER
Button Bonanza
Collections of data represented in stem and leaf plots are organized by young statisticians as they embark some math engaging activities.
CK-12 Foundation
CK-12 Middle School Math Concepts - Grade 6
Twelve chapters cover a multitude of math concepts found in the Common Core standards for sixth grade. Each title provides a brief explanation of what you will find inside the chapter—concepts from which you can click on and learn more...
Curated OER
Looking for More Clues
Fifth graders explore how to collect data and display it on a bar and circle graph.
Alabama Learning Exchange
Jelly Beans Add Up
Students explore counting, sorting, and graphing skills. In this data analysis lesson, students sort jelly beans by color, count the jelly beans, and create a bar graph of the jelly beans according to color.
Curated OER
Connecting With Coordinates
Play a coordinates game to encourage collaborative learning and grid use! Learners plot points on grids and play a game that challenges them to locate a specific point on a coordinate grid by using horizontal and vertical movements.
Center Science Education
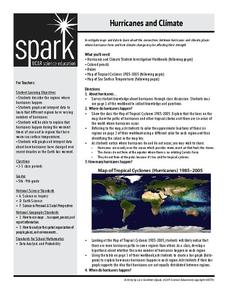
Hurricanes and Climate
Feeling under the weather? This lesson on hurricanes can whip things up! With professionally designed maps and handouts, teach your future weathermen (or women) where, when, and how hurricanes occur. They identify hurricane regions and...
Curated OER
Pumpkin Play
Have you ever examined a pumpkin and estimated the number of lines it has? In this math lesson, students count the actual number of lines, record and graph the results. They investigate the circumference, weight and buoyancy of the...
Curated OER
Rainforest Data
In this geography learning exercise, students use the climate data given to create a temperature line graph and rainfall bar graph for each of three locations given. Then they use an atlas to compare their graphs and draw conclusions...
Curated OER
Algebraic Thinking - Equations
Fifth graders explore equality and inequality by participating in a Tilt/Balance activity. The students listen to the story "Lemonade for Sale" by Stuart J. Murphy and use equations to graph lemonade sale profits.
K12 Reader
Displaying Data
It's important to learn how to display data to make the information easier for people to understand. A reading activity prompts kids to use context clues to answer five comprehension questions after reading several paragraphs about...
Curated OER
Saving Money Through Mathematics
Third graders discuss light sources and collect data about energy sources. They compare data and create a multiple line graph showing energy used by light sources for each student in the group. They present their graphs and write a...
Curated OER
Dental Detectives
First graders explore the theme of dental health and hygeine. They make tooth loss predictions, count lost teeth, and graph tooth loss. In addition, they listen to dental health stories, read online stories, create spreadsheets, and play...
Education.com
Measure School Supplies
Ever wonder how long a pair of scissors are? Find out with this simple measuring activity in which pupils use the provided ruler to determine the length of four common classroom supplies.
Other popular searches
- Line Pie Bar Graph
- Line/bar Graph
- Line and Bar Graphs
- Line Bar and Circle Graphs
- Line Graph Bar Graph
- Line, Bar, and Circle Graphs
- Line, Bar and Circle Graphs
- Double Bar Line Graphs


