Curated OER
Venn Diagram and UK Basketball
Students analyze data and make inferences. For this algebra lesson, students collect and analyze data as they apply it to the real world.
Curated OER
Drawing Bugs Game
Second graders explore probability by playing a drawing game with dice. After they roll a die, they draw a tree diagram to illustrate each of the possible outcomes.
Curated OER
Probability Popsicle Pop-ups
Fourth graders decorate and use popsicle sticks as manipulatives to assist with their learning of probability. They utilize a worksheet imbedded in this plan to organize the results of their experiment. They make a stem and leaf plot...
Curated OER
Pond Theme Unit
For this pond theme worksheet students research facts on pond life. Students complete comprehension questions, crosswords, word search, and math puzzles. Students write a short report.
Curated OER
What did I find?
Students excavate an artifact. In this archaeology lesson plan, students get a bucket filled with dirt and a broken up artifact. They work in groups to take it out and to find what its purpose was.
Curated OER
HEART THROBS
Learners predict what might happen to their pulse rates after physical exertion and then make conclusions about the effects of physical activity on pulse rates.
Curated OER
Does One Tree a Forest Make?
Students take a walk around the schoolyard looking at and identifying the trees. One leaf for each tree is collected. A chart is developed that represents the population of trees on the school ground. They keep journals and write an essay.
Curated OER
Solar Power
Fifth graders create their own solar panel. They use this experiment to see how the sun can be used as a form of energy.
Curated OER
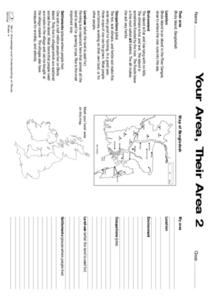
Your Area, Their Area
In this Your Area, Their Area worksheet, learners locate and identify an area on a map, then write short answers to factors about it. They then create a poster with materials provided.
Curated OER
Weather in Your City
Students observe weather conditions of a particular city. Multiple intelligences are explored within this lesson. They locate their particular city on a United States map. Each student writes about their discoveries in his/her journal...
Curated OER
Energy Efficient Buildings
Seventh graders create plans for an energy efficient addition to the school. They work in small groups with each group having responsibility for examining one aspect of the problem. They create working diagrams and a model of their...
Curated OER
Mummy Dearest
Students assess what environmental conditions best contribute to preservation and mummification by participating in a multi-day 'apple mummification' lab.
Curated OER
"Measurement in Motion"
Ninth graders examine the rate of motion and changes in motion using a ramp and a rolling object. They conduct the demonstration, determine the average speed, and describe how a moving object can have zero acceleration and deceleration.
Curated OER
Box-and-Whisker Plots
Eighth graders measure in feet and inches and convert to explore the relationship between the converted measurements. In this measurement lesson plan, 8th graders use the whisker and box plot to represent the measurement of a cat. ...
Curated OER
Pick A Number
Elementary schoolers find out which month has the most class birthdays (mode) and which birthday represents the middle point of all the birthdays (median). They gather and organize data to find one number that fairly represents the whole...
Howard Hughes Medical Institute
Tracking Genetically Modified Mosquitoes
What's that buzzing in your ear? An insightful lesson about genetically modified mosquitoes! Partnered pupils explore the creation, release, and monitoring of mosquitoes designed to reduce the mosquito population. After watching a video,...
Virginia Department of Education
Mathematics Vocabulary Cards - Grade 2
Augment your math curriculum with posters detailing several concepts important to second grade math. Each poster features one math term from geometry, measurement, probability and statistics, computation and estimation, numbers and...
Purdue University
The Represented World: Recreational STEM
How are forces and motion important to a swing set? Scholars explore the concepts of force and motion using swing sets. In preparation for their own STEM design project, individuals take surveys and data from peers, complete labs on...
Curated OER
Population Pyramids
Students create a population pyramid based on current data for their final project country. They analyze data from comprehension trends of final project country. Students analyze populations of specific countries.
Curated OER
The Dog Days of Data
Students practice an alternative form of data presentation. They practice sequencing data, identifying the stem-and-leaf, creating stem-and-leaf plots, and drawing inferences from the data by viewing the plots.
Curated OER
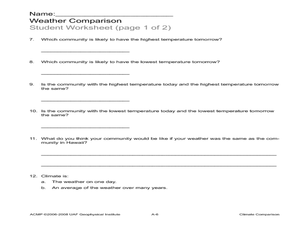
Climate Comparison
Students explore climate regions. In this climate lesson, students examine the climate regions of Alaska as well as the state of Hawaii. Students research selected Internet sources to gather information regarding the climates present in...
Curated OER
When You're Hot, You're Not!!
Students investigate volcanoes. In this landforms lesson, students locate two volcanoes on a world map. Students compare and contrast the types of volcanoes by using various Internet sites.
Curated OER
Pumpkin Seed Data!
Second graders work with pumpkins to estimate, then accumulate data about pumpkin seeds. After cleaning out the pumpkins, 2nd graders utilize a worksheet imbedded in this plan which has a variety of pumpkin math activities they can do.
Curated OER
Oh Deer!
Students discuss the components necessary to keep animal populations alive . Then they participate in a game where they interact as deer, food, water, and shelter. The activity demonstrates that nature is not static, but changes with the...
Other popular searches
- Line Pie Bar Graph
- Line/bar Graph
- Line and Bar Graphs
- Line Bar and Circle Graphs
- Line Graph Bar Graph
- Line, Bar, and Circle Graphs
- Line, Bar and Circle Graphs
- Double Bar Line Graphs


