EngageNY
Interpreting Division of a Whole Number by a Fraction—Visual Models
Connect division with multiplication through the use of models. Groups solve problems involving the division of a whole number by a fraction using models. The groups share their methods along with the corresponding division and...
EngageNY
Interpreting Division of a Fraction by a Whole Number—Visual Models
Divide fractions just like a model does. Pupils visualize the division of a fraction by a whole number by creating models. Scholars make the connection between dividing by a whole number and multiplication before practicing the skill...
Curated OER
A Musical Composition Experience
Upper graders having skills in music performance will extend their abilities through creative musical composition. They'll use Finale 2000 to explore facets of music composition, they'll then compose a piece for their instrument in C, F,...
Curated OER
Reading and Interpreting Graphs
In this reading and interpreting graphs worksheet, students answer 8 word problems that involve reading information from a graph about pizzas. Students then review a second graph centered on music and answer 12 questions.
Curated OER
Magnetism
All phenomena concerning magnets, their field lines and impact on objects are covered. The trivia surrounding field lines and the earth, electric charges, repulsion and attraction is plentiful. The slide show continues after twenty...
Illustrative Mathematics
Shirt Sale
Everyone loves a good deal, and your mathematician's job is to calculate the original price when given the discount. A different type of problem than the traditional "find the percent change" has your learners working backwards to...
Curated OER
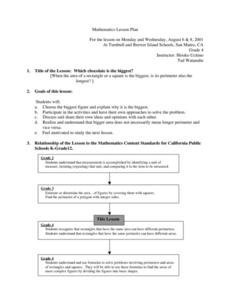
Which Chocolate Is The Biggest?
Students investigate the concepts of area and perimeter with the use of chocolate bars. They calculate the perimeter and area of different size rectangle chocolate bars and record the statistics. Then students make a visual comparison...
Illustrative Mathematics
A Pencil and a Sticker
How much do a pencil and sticker cost? Youngsters use a bar diagram to find the cost of a sticker that is twenty cents less than the cost of a pencil. Given the prices, learners must find the cost of the sticker in order to find the cost...
Curated OER
Counting Votes
Here's a great way to combine a good class discussion on nutrition with math. A class discussion on what can be made from vegetables is held, then learners all vote for their favorite vegetable. A graph is produced that shows the...
Curated OER
Rain Forests: A Disappearing Act?
Students examine and locate rainforests on maps, and research the patterns of their destruction. They develop a bar graph of rainfall and temperature data, write a journal entry, and research the people, animals, and plants/products of...
Curated OER
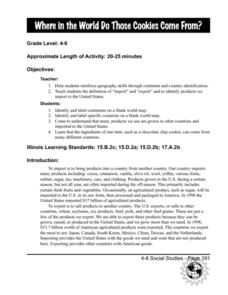
Where in the World Do Those Cookies Come From?
Learners discuss exports and imports by discovering where the ingredients come from for making chocolate chip cookies. They take a survey of their favorite cookies and create a bar graph to represent the information.
Curated OER
Make Your own Word Search
Students use the internet to create their own word search. Following the directions, they use a puzzle making site to create their word search with words related to school. They practice navigating through various websites and using a...
Curated OER
Stone Soup
Second graders examine recipes to determine the importance of the sequencing and ingredients. They talk about their favorite family recipes while discussing connections foods brings to families. While reading Stone Soup they focus on the...
Curated OER
Do You Measure Up?
Students measure their height and then they will input the information into a spreadsheet. After the data is entered, students will use the material gathered to create a bar graph showing the heights of people in their class.
Curated OER
What's Playing Tonight?
Students collect data and visually represent it. They conduct a survey of favorite movies. Using a spreadsheet, students organize the data and create bar and circle graphs. Students answer statistical questions regarding the data.
Curated OER
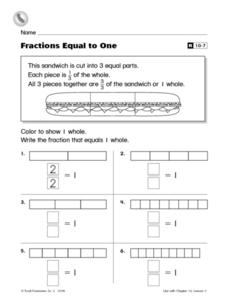
Fractions Equal to One
Make learning fractions easy for your second and third graders! They refer to a picture of a sandwich cut in thirds to remember that all three pieces put together is one whole. Then they color in different horizontal bars to illustrate...
Curated OER
Writing Variable Expressions for Physical Models
Explore the concept of writing variable expressions by examining the similarities between expressions with numbers and expressions with variables. Emerging mathematicians determine rules for sequences and patterns before writing a rule...
Curated OER
Lesson: Soapin' It Up
A Japanese Shinto deity from the early 900s inspires youngsters to think symbolically. They analyze the carved sculpture, the techniques used to create it, and its cultural or symbolic meaning. Then, they design and carve a symbolic...
Ohio Department of Education
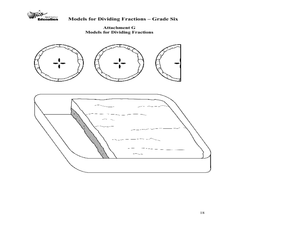
Models for Dividing Fractions - Grade Six
Fifth and sixth graders use food and candy to help them represent division of fractions and develop algorithms to solve fraction problems. They discuss dividing whole numbers by fractions. Pupils use sticks and chocolate bars to study...
Curated OER
America Moves to the City (1865-1900)
Statistical data can show shifts in human populations without bias or a prescribed historical point of view. View bar graphs and charts that describe new influxes in urbanization, immigration, and suffrage by state during the turn of the...
Curated OER
Tree Measurement
Measure a tree? Yes, measure a tree! Students get outside and measure a tree's trunk, crown, and height. Each group compares their answers to determine if any re-measuring is necessary. Once back in the classroom, students make bar...
Curated OER
Graphic Scores
You can write some music scores using images rather than musical notation. Kids learn how they can become musical composers by using graphics or images in place of musical notation. An interesting slide-show, but a more interesting...
Curated OER
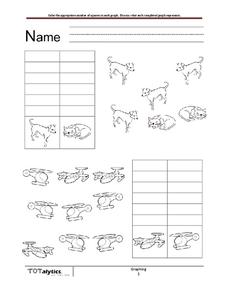
How Many?
How many cats are there? Dogs? As learners examine a set of images, they fill in a chart to indicate how many of each image there are. In the first series, there are four dogs and two cats. In the second, there are three planes and six...
Curated OER
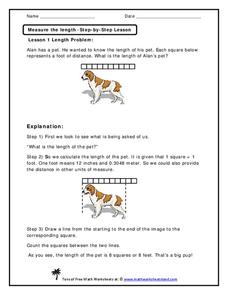
Measure the Length
Practice measurements with your scholars using this word problem. Because the answer is explained at the bottom of the page, this would work best as an all-class warm up. Cover up the answers until after kids have shared responses. They...
Other popular searches
- Fraction Bars
- Hershey Fraction Bars
- Fractions With Chocolate Bars
- Candy Bars
- Fractions With Hershey Bars
- Math Comparison Bars
- Measurement Bars
- Fractions Fraction Bars
- Fractions and Fraction Bars
- Hersey Bars
- Integer Bars
- Make Fraction Bars


