Math Mammoth
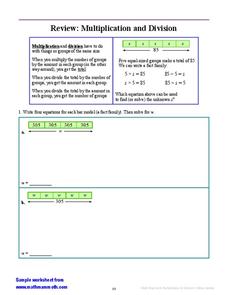
Multiplication and Division
In this multiplication and division worksheet, students review both methods and then match the equations to the multiplication or division diagrams and solve for y. Students then write four equations for the diagrams and solve for w....
Curated OER
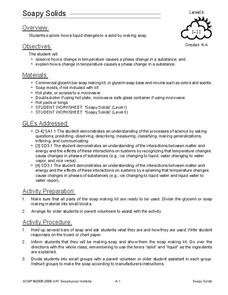
Soapy Solids
Students observe and explain how a change in temperature causes a physical change in a substance. In this physical science lesson, students use a soap making kit to observe the effects of adding heat to the bar soap as they create a bar...
Curated OER
Decisions, Decisions, Decisions
Students examine graphs to find the most appropriate for various kinds of data. In this graphing instructional activity, student create bar, line and circle graphs. Students create graphs electronically and manually interpreting the data.
Curated OER
Charts and Graphs
Fifth graders interpret data into graphs and percentages. In this organizing data instructional activity, 5th graders discuss bar, circle and line graphs. Students complete bar graph and apply probability using the results.
Curated OER
Interpreting Data and Statistics
Students define terms and analyze data. In this statistics lesson plan, students plot their data using bar and line graphs. They analyze their data after they graph it and apply the results to the Great Depression.
Curated OER
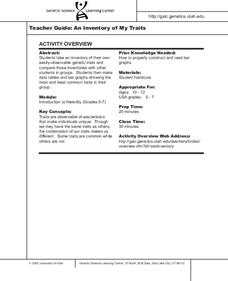
An Inventory of My Traits
Students take an inventory of their own easily-observable genetic traits and
compare those inventories with other students in groups. They then make
data tables and bar graphs showing the most and least common traits in their group.
Curated OER
Count The Letters
Students perform activities involving ratios, proportions and percents. Given a newspaper article, groups of students count the number of letters in a given area. They use calculators and data collected to construct a pie chart and bar...
Curated OER
A Fun Alternate Way to Teach Children Keyboarding1
Students use mnemonics rather than mindless repetition to help them remember keyboard locations. They examine the left side home row, backspace key, and space bar using large, teacher-made keyboard.
Curated OER
Quick Stats with Quick Poll
Learners analyze data using bar graphs and the TI in this statistics lesson plan. They investigate quick polls and graph the data using different properties of statistics. This assignment requires a TI Navigator.
Curated OER
An Inventory of My Traits
In this biology activity, students identify and describe a number of easily observable genetic traits and compare the traits they have with other students. Then they identify and describe that some traits are common while others are not...
Curated OER
Graphing - Length
In this graphing instructional activity, students create a bar graph showing the approximate maximum length of 12 different types of fish.
Curated OER
Our Favourite Halloween Treat
Students conduct a survey about Halloween candy and create a bar graph illustrating the data. In this data analysis activity, stud nets are introduced to the topic with a discussion and survey, then the class creates a large graph and...
Curated OER
Mass/Weight/Data/Graphing-What Is The Mass of a Dinosaur?
Students determine the mass of various "dinosaur eggs" and graph their data. For this mass, weight, data and graphing lesson plan, students measure the mass of different weighted "dinosaur eggs". They record their data and transfer it to...
Curated OER
Data Analysis and Probability Race to the Finish
Students practice addition facts, record data, and construct a bar graph. In this probability lesson plan, students participate in a board game in which bicycles move towards a finish line based on players completing addition problems....
Curated OER
Pancakes, Anyone?
First graders explore data collecting and graphing. In this data collecting and graping lesson, 1st graders watch a video about monster who sells pancakes. Students make a graph to record the most popular pancake. Students also play...
Curated OER
Civil War and Reconstruction
Students examine the differences between the North and South during the pre-Civil War era. In this Civil War era lesson plan, students spent 7 days looking at things that were different between the Union and Confederate state before the...
Curated OER
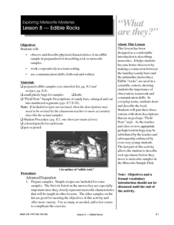
Edible Rocks
Young scholars create meteorite models using candy bars. In this earth science lesson, students describe the physical features of a meteorite. They sketch it and write a short description about it.
Curated OER
Simply the Best
Students determine whom they consider "the best" performer in a variety of entertainment industries and discuss how to accurately measure greatness. They create bar graphs comparing statistics of the 1975 Cincinnati Reds and the 1998 New...
Curated OER
Why Can't I Vote?
Fourth graders take an unannounced test (failure is expected) and the top scores are rewarded with candy bars. They compare this test to the literacy tests given before 1960 and votes to candybars. They journal their responses.
Curated OER
Soapy Stress
Students investigate the three types of material stress related to rocks. They identify the three types of stress, conduct a simulation by breaking bars of soap using only their hands, and complete a worksheet.
Curated OER
Singing The Blues with Garage Band
Students demonstrate writing lyrics for a twelve-bar blues pattern by writing two verses of a blues song and then recording themselves singing over a stock blues pattern using Apple's Garage Band. Requires a networked keyboard lab.
Curated OER
Mapping the Ocean Floor
Students construct and interpret a line graph of ocean floor depth and a bar graph comparing the height/depth of several well-known natural and man-made objects and places. In addition, they calculate the depth of two points using sonar...
Curated OER
Jelly Bean's Galore
Students investigate the origins of the Jelly Bean. They complete a Scavenger Hunt using the jellybean website. Pupils create a bar graph using information collected about jelly beans. Students discuss the time of year that Jelly Beans...
Curated OER
Food Chains
Students study food chains by creating their own slide show using KidPix. They compare information after sharing their slide shows as a whole group. As the children are watching the slide shows of their peers, they tally every time...
Other popular searches
- Fraction Bars
- Hershey Fraction Bars
- Fractions With Chocolate Bars
- Candy Bars
- Fractions With Hershey Bars
- Math Comparison Bars
- Measurement Bars
- Fractions Fraction Bars
- Fractions and Fraction Bars
- Hersey Bars
- Integer Bars
- Make Fraction Bars


