EngageNY
Mid-Module Assessment Task: Grade 6 Math Module 2
Make sure scholars know all about fractions and decimals — not just a fraction of the information. The 12th installment of a 21-part series is a mid-module assessment. Learners solve problems in the context of a birthday party and a...
Curriculum Corner
Second Grade Summer Math Practice Book
Stop the summer lag with a set of second grade Common Core based math practice sheets. Learners fill in hundreds charts with missing numbers up to 1,000. They practice writing numbers in standard, expanded, and word form. Children also...
CK-12 Foundation
Graphs for Discrete and for Continuous Data: Discrete vs. Continuous Data
Not all data is the same. Using the interactive, pupils compare data represented in two different ways. The learners develop an understanding of the difference between discrete and continuous data and the different ways to represent each...
Science 4 Inquiry
Snakes in the Everglades
The Burmese python is on the loose ... and he's hungry! Illustrate the differences between causative and correlative relationships through an inquiry lesson. Pupils examine several sources of information to determine if there is a...
Radford University
Marketing Mayhem: Advertising for Adolescents
You'll be sold on using the resource. Future consumers first conduct a sample survey on marketing strategies. They then consider how mass media influences their age groups and create presentations to display their findings.
CK-12 Foundation
CK-12 Middle School Math Concepts - Grade 6
Twelve chapters cover a multitude of math concepts found in the Common Core standards for sixth grade. Each title provides a brief explanation of what you will find inside the chapter—concepts from which you can click on and learn more...
US Department of Commerce
Featured Activity: Population Change Over Time
Keep track of a state's population. After a brief discussion on how population data is used for funding, individuals look at population changes over time. Pupils find the population of two states using three different censuses. They then...
Curated OER
Graphing Lesson Plans
By using hands-on graphing lesson plans students can learn how to collect data, and display the information using graphs.
Curated OER
J.S. Bach (1685-1750): Sarabande and Gigue form Partita no.4 in D major, BWV 828
Challenge your music students with this worksheet, which includes twenty-one questions about J.S. Bach's Sarabande and Gigue form Partita no.4 in D major, BWV 828. Students compare the two sections (bars 1-12, bars 13-38) by answering...
Curated OER
Fractions of Whole Numbers 1
In this math activity, students use line graphs and fraction bars to multiply fractions and whole numbers. The fraction is represented on the line graph and the whole number on the fraction bar.
Curated OER
Animals Finding Rice Paddies
Fourth graders examine the animals who live in rice paddies and create a chart. In this rice instructional activity, 4th graders link the types of animals living in each ecosystem with a bar graph. Students use colored bars to show...
Curated OER
A Plop and Fizz
Seventh graders perform an experiment to determine the effect of temperature on reaction rates. In this chemistry lesson plan, 7th graders take measurements and record data. They create a graph and analyze results.
Curated OER
Usage and Interpretation of Graphs
Learners review graphing and use processing skills to solve problems.
Curated OER
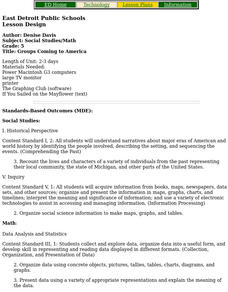
Groups Coming to America
Fifth graders use text or other references to locate different types of information about the Mayflower and pilgrims. They create a presentation for lower elementary classes about the Pilgrims.
Curated OER
ESTIMATION
Young scholars practice estimating and counting and using a ruler to measure distance.
Curated OER
High School Mathematics Problems from Alaska: Fire Fighting Crew
Students apply mean, median and mode calculations of firefighter test scores to decide on hiring.
Curated OER
Celebrate Hispanic Heritage Month!
Students use information from the U.S. Bureau of the Census to create a bar graph, a picture graph, or a circle graph showing the country of origin of U.S. Hispanics.
Curated OER
The North (Wall) Star
Young scholars engage in a lesson which shows them that celestial navigation is the art and science of finding one's geographic position by means of astronomical observations, particularly by measuring altitudes of celestial objects -...
Curated OER
Biodiversity
Students investigate the diversity of temperate forests and tropical rainforests. They catch and observe local insects, sort leaves and insects on a chart, listen to the book "A Walk in the Rainforest," and create a class bar graph that...
Curated OER
Relative Dating-Telling Time Using Fossils
Learners explore how to read fossil range charts. They develop an knowledge of the strengths and weaknesses of the fossil record. Students become familiar with the concepts index fossil and fossil range. Learners use bar graphs to...
Curated OER
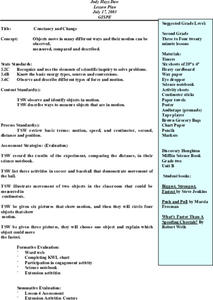
Constancy and Change
Second graders investigate how objects can move in different ways. They move in different ways across the room and develop a class list of movement words. Students also conduct a measuring motion experiment, create a bar graph for the...
Curated OER
Graphing Predator/Prey Data
Students use data from the Camouflage Game (played with red and green yarn caterpillars) to create a composite bar graph to display the collected data. They interpret the data and form a conclusion based on the graphs. Teachers may use...
Curated OER
Fabulous Forensic Fingerprints
Students explore the uniqueness of each person's individual body. They identify traits and characteristics of the human body, with a main focus on the uniqueness of fingerprints and footprints. Students examine and compare fingerprints....
Curated OER
Our Pets
In this graphing worksheet, young scholars survey their classmates about what pets they like. Students record the data in the form of a bar graph. There are 8 choices listed.
Other popular searches
- Fraction Bars
- Hershey Fraction Bars
- Fractions With Chocolate Bars
- Candy Bars
- Fractions With Hershey Bars
- Math Comparison Bars
- Measurement Bars
- Fractions Fraction Bars
- Fractions and Fraction Bars
- Hersey Bars
- Integer Bars
- Make Fraction Bars


