Curated OER
Variables on Both Sides
Young scholars solve equations containing variables on both side of the equal sign. For this algebra lesson, students combine like terms using opposite signs to get them on one side of the equal sign. They model the equations using bar...
Curated OER
Genre Lesson: What is a Mystery?
Examine the elements in a mystery with The Westing Game. Learners unscramble words as if they had to put clues together. Additionally, they discuss terms used in mysteries. They practice the word using the context of the story, as well...
Curated OER
Analyze The Learner; Chocolate Fractions
Third graders describe, represent and compare fractions using pieces of a chocolate bar. In this fractions instructional activity, 3rd graders demonstrate how to read and write fractions correctly. Students then integrate technology by...
Curated OER
“My Little Sister Hugged An Ape” | Literature, Math, & More!
Students read the story "My Little Sister Hugged An Ape" and make a list of sensory words from the story. For this interdisciplinary math lesson, students participate in sensory writing, and complete a questionnaire which they will use...
Curated OER
So Fast! So Slow!
Fifth graders give examples of objects that move slow and fast. In this physics lesson plan, 5th graders rank animals according to how quickly they move. They create a bar graph of organisms versus rates of speed.
Curated OER
Comparing And Ordering Decimals
In this decimals worksheet, students compare and order decimals using comparing symbols, ordering from least to greatest, answering word problems, and deciphering a bar graph. A very nice resource.
Curated OER
Simple Machines
In this physics activity, middle schoolers use the clues given on the sheet to complete the crossword puzzle on simple machines. There are 18 clues to solve in the puzzle.
Curated OER
Dr. Seuss Blank Graph
For this literature worksheet, students use a blank bar graph grid to record all of the Dr. Seuss books they read. No labels are on the graph.
Visa
Privacy Please: Protecting Your Identity
What are the different ways we are susceptible to identity theft? Impress the importance of protecting personal information and privacy with this resource, which includes an excellent video clip, discussion prompts, and worksheets for...
Curated OER
Chocolate Bar Bugs & Marshmallow Spiders
Students create an insect model with food materials. After a brief discussion of insects, student use food materials provided by the instructor to create their own insect model. Models are shared with the class before they are eaten by...
Curated OER
Cookie Bar Coal
Students observe the effect of heat and pressure on materials representing those involved in the formation of coal.
Curated OER
Comparing Candy Bars
Eighth graders identify that a ratio is a comparison of two numbers and that a proportion is an equation that equates two ratios. They identify the extremes and means of proportions, as well as the product of the extremes equals the...
Curated OER
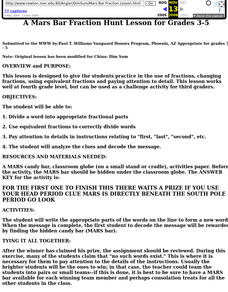
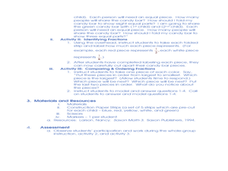
China: Dim Sum: A Mars Bar Fraction Hunt Lesson
Students practice in the use of fractions, changing fractions, using equivalent fractions and paying attention to detail.
Curated OER
Creating a Bar Graph Using a Spreadsheet: Dice Rolling Probabilities
Tenth graders explore the concept of spreadsheets. They create a simple spreadsheet and chart from given data. Students perform basic formatting procedures on their chart. They use spreadsheet functions to perform calculations.
Curated OER
Graphing a Survey
In this mathematical activity, students survey a selection of thirteen people to find out if they like to eat ice cream, cakes or pies and then fill in their graphs with the data they've collected.
Curated OER
Graphing Grid
In this graphing worksheet, students are given a blank graph to fill in with their own information. Four columns are included, each consisting of six boxes.
Curated OER
Nine Examples for Tables, Pictographs, Mean. Median, and Mode
In this graphical representation of data and measures of central tendency worksheet, students calculate mean, median, and mode and answer questions related to graphs, tables, and pictographs.
Curated OER
How Hard is Chocolate?
Students conduct an experiment mimicking a hardness test. They determine the hardness of chocolate bars. Students examine indentations to determine the hardness of chocolate bar and infer reasons for the differences in hardness. They...
Curated OER
Sweet Fraction Frenzy
Fourth graders compare and order fractions. In this comparing and ordering fractions lesson plan, 4th graders make fraction strips from construction paper but pretend that they are candy bars. They use the strips to compare and order...
Curated OER
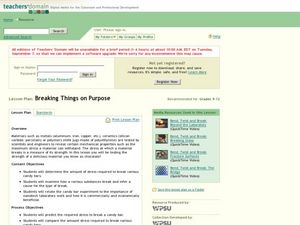
Breaking Things on Purpose
Pupils predict the required stress to break a candy bar. They examine how a various substances break and infer a cause for the type of break.
Students relate the candy bar experiment to the importance of nanotech laboratory work and how...
Curated OER
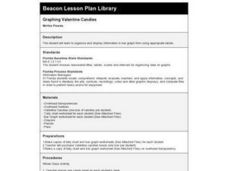
Graphing Valentine Candies
Fifth graders organize and display information in bar graph form using appropriate labels. Each student receives a box of Valentine heart candies, a worksheet of the tally chart and a worksheet of the bar graph.
Curated OER
Mechanical Properties of Chocolate: How Hard is your Chocolate?
Students calculate, measure and identify the hardness of various chocolate bars. They determine the hardness of the chocolate bar using quantitative data. Students make observations of the hardness of chocolate while dropping the...
Curated OER
Skittles, Taste the Rainbow
Fifth graders learn and then demonstrate their knowledge of a bar and a circle graph using the classroom data. Students are given a pack of skittles candy. Students create a bar and circle graph indicating the results of the contents of...
Curated OER
Archaeology Vocabulary Sampling
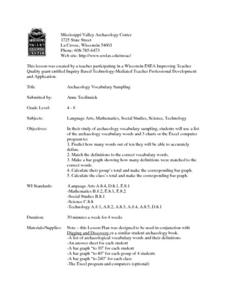
Students predict how many words out of ten they accurately define. They match the definitions to the correct vocabulary words and make a bar graph showing how many definitions were matched to the correct words. The write their group...
Other popular searches
- Fraction Bars
- Hershey Fraction Bars
- Fractions With Chocolate Bars
- Candy Bars
- Fractions With Hershey Bars
- Math Comparison Bars
- Measurement Bars
- Fractions Fraction Bars
- Fractions and Fraction Bars
- Hersey Bars
- Integer Bars
- Make Fraction Bars


