Curated OER
Range and Mode
Students interpret data from graphs. In this range and mode lesson, students review a tally chart, pictograph and bar graph. Students use these graphs to calculate the range and mode of each set of data.
Curated OER
The Immigrants of Brooklyn: Now And Then
Young scholars compare the immigrant population during the pre-Civil War era (1855) to that of today (2000 census data). They interpret circle and bar graphs comparing immigrant populations in Brooklyn yesterday and today, and create a...
Curated OER
Arrays And Factors
Students participate in a lesson that is concerned with the concepts of arrays and factors. They use a Hershey bar and divide it into segments in order to simulate the arrays. Then students construct other arrays from the leftover pieces.
Curated OER
Learning Musical Terms
Students observe and discuss the following musical terms and their symbols: staff, measure, bar line, double bar line, treble clef, bass clef, time signature, common time, cut time, quarter note, half note, dotted half note, whole note,...
Curated OER
Chocolate Fractions
In this math learning exercise, students practice answering the questions to create fractions in the context of a chocolate bar. They are comparing values.
Curated OER
Building a Journalism Team
Students play a granola bar relay to learn about the importance of teamwork in a journalism team. In this journalism team lesson plan, students use granola bars to participate in a relay activity to improve their communication as well as...
Curated OER
Show Me!
Students analyze and interpret graphs. In this graphing lesson, students view a video and construct their own graphs (line, circle, bar) from given sets of data.
Curated OER
Graphing With Paper and Computers
Fourth graders construct bar graphs. In this graphing lesson, 4th graders create bar graphs in connection with the story, The Copycat Fish. After creating the initial graphs on paper, students use MS Excel to create graphs.
Curated OER
Histograms: Homework
In this histograms worksheet, learners learn how to make a histogram. Students give graphs a title, draw the axes, label the vertical axis, choose an appropriate scale, and mark equal intervals. Learners label the horizontal axis with...
Curated OER
Giving an Outdoor Play
Students reenact a popular book while using their outdoor playground as the stage. In this dramatic interpretation instructional activity, students follow oral narration to act out events in a story. They use monkey bars as the setting...
Curated OER
Measuring Height
In this measurement worksheet, students cut out a measuring bar, using it to color in specific heights of 3 different bars. Worksheet has a reference web site for additional activities.
Curated OER
Chocolate Place - Factories around the world
Students create a PowerPoint presentation on how chocolate is made. In this chocolate lesson, students locate chocolate factories around the world, and study the process of converting the cacao seed into a chocolate bar. Students share...
Curated OER
Graphing Data Brings Understanding
Students collect, graph and analyze data. In this statistics lesson, students use circle, pie, bar and lines to represent data. They analyze the data and make predictions bases on the scatter plots created.
Curated OER
C is for Cookie-A MEAN-ingful Graphing Activity
Third graders, in groups, dissect a variety of brands of chocolate chip cookies and calculate the mean for each brand. They create their own bar graphs, pictographs, and line graphs to represent information.
Curated OER
American Music Styles: Blues - Lesson 2
Students describe some of the distinguishing characteristics of blues music. They compare and analyze two versions of the same 12-bar blues song. They read and identify notation symbols for rhythm and tempo.
Curated OER
I've Got the Blues!
Students identify the musical form of the 12-bar blues. They identify a problem from the "Farming in the 1940's" section and compose a 12-bar blues song. make comparisons between problems of the 1940's and today.
Curated OER
Candy Quakes
Eighth graders, using a candy bar, gum, and Twizzlers, demonstrate the effects of deformational forces on the earth's crust. They examine the processes of rock and fossil formation.
Curated OER
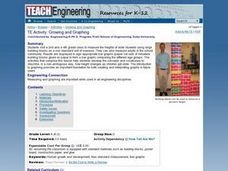
Growing and Graphing
Pupils visit a 2nd and a 4th grade class to measure the heights of older students using large building blocks as a non-standard unit of measure. They can also measure adults in the school community. Results are displayed in...
Curated OER
Light Plants and Dark Plants, Wet Plants and Dry Ones
Students plant sunflower seeds in plastic cups, and once germinated, these are exposed to different conditions of light levels and/or soil moisture contents. Students measure growth of the seedlings every few days using non-standard...
Curated OER
Halloween Candy/ Sugar Content
Fourth graders examine the amount of sugar contained in Halloween candy by looking at nutritional labels from candy bars. They figure out ways to encourage people to reduce the amount of sugar they eat at this holiday. They look at the...
Curated OER
Measure the Lines
For this measurement worksheet, students cut out a measuring bar and use it to measure and color given lengths. Worksheet has a reference web site for additional activities.
Curated OER
Magnets
Students explore the concept of magnetism. In this magnetism instructional activity, students use bar magnets to conduct experiments regarding magnetism. Students also use a magnetic compasses to examine magnetic poles.
Curated OER
Effects of chemical use in Agriculture
Students research environmental data to create a bar graph. In this agricultural ecology lesson, students research the pros and cons of chemical use in farming. Students debate on passing a law to reduce chemical use.
Curated OER
The Dark Side of Chocolate
Students learn just what goes into a chocolate bar. In this chocolate lesson, students research cacao beans and the nations that produce them. Students also examine chocolate recipes.
Other popular searches
- Fraction Bars
- Hershey Fraction Bars
- Fractions With Chocolate Bars
- Candy Bars
- Fractions With Hershey Bars
- Math Comparison Bars
- Measurement Bars
- Fractions Fraction Bars
- Fractions and Fraction Bars
- Hersey Bars
- Integer Bars
- Make Fraction Bars


