Curated OER
Probability and Statistics
Elementary schoolers choose from a host of activities to investigate probability and statistics. They complete worksheets, create 3-D graphs, and play graph bingo. They make weather predictions and list all the possibilities before going...
Math Mammoth
Word Problems
Upper grade and middle school learners problem solve and calculate the answers to twenty various word problems involving multiplication, and a bar graph.
Curated OER
Mental Math: Subtract Tens, Problem Solving
Subtracting by 10s is easy for your young learners with this worksheet! There are three questions to accompany a bar graph, and there's a space for learners to explain their answers. Encourage them to use mental math here!
Houghton Mifflin Harcourt
Use a Graph: Measure Fish
Something's fishy here! Use the bar graph provided to determine the length of each fish shown. Small cartoon fish make this an engaging learning exercise for young learners. There are six questions provided.
Curated OER
Physical Science: Festival of Bubbles
Investigate bubbles through the use of scientific inquiry. Pupils blow bubbles using several methods and measure the resulting bubble print. Measurements are recorded on a data table and transferred to a bar graph. Results are discussed...
Curated OER
Trash to Gas
Students experiment with biomass materials as alternative energy sources. For this biomass material lesson, students participate in an experiment with cow manure to determine how it can be used as an energy source. They record their data...
Curated OER
Call it "Macaroni"
Who knew there were so many fun educational opportunities featuring pasta? Scholars read a brief informational text about the history of pasta (note that "macaroni" is spelled two different ways, so address this if kids are reading...
Illustrative Mathematics
Weather Graph Data
Teaching young mathematicians about collecting and analyzing data allows for a variety of fun and engaging activities. Here, children observe the weather every day for a month, recording their observations in the form of a bar graph....
Curated OER
Tim and Pat at the Store: Bar Graphs
Do you like candy? Tim and Pat go to the candy store every day after school. Can you use the chart to determine how much money they spend each day? Does one spend more than the other?
Curated OER
Bar Graphs
In this bar graph worksheet, students complete math problems having to do with different bar graphs. Students complete 10 problems for 10 different graphs.
Curated OER
Data Handling: Bar Chart Showing Frequency
In this bar graph worksheet, students analyze a bar graph showing soccer goals scored. Students then use the data to solve 7 problems.
Curated OER
Reading a Bar Graph
In this reading a bar graph worksheet, students look at the bar graph about favorite colors and write the number that each bar represents.
Texas Instruments
Data Collection for Bar Graphs
Learners study the concept of central tendency in this data collection for bar graph lesson. They collect data outside as instructed and organize it into a bar graphs, then they list in specific groups the labels that appear on the...
Curated OER
Problem Solving: Use a Bar Graph
In this using a bar graph to solve a word problem instructional activity, students refer to the U.S. Radio Station Formats bar graph to write the steps needed to solve and explain how the bar graph helped solve the problem. Students...
Curated OER
Learning to Read Graphs
What is your favorite pet? This is a great tool for youngsters just learning how to read and interpret graphs. There are four simple questions. Consider extending this activity by creating a class bar graph: how many learners have a dog,...
Curated OER
Learning to Read Graphs 2
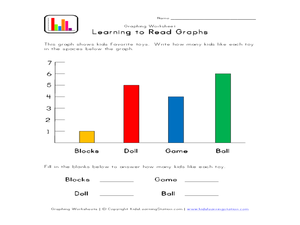
Do you like playing with blocks, dolls, games, or balls? Use this basic graph to review bar graphs with young learners. After completing the four questions below, consider creating your own class graph: who likes blocks the best? Who...
Liberty Union-Thurston
Equivalent Fractions
The next instructional activity in a math series builds off the previous one in which learners estimated fraction amounts using fraction bars. Here, pupils view equivalent fractions with unlike denominators using fraction bars. Lastly,...
World Wildlife Fund
Graphs and Charts
A two-part worksheet incorporating bar graphs and pie charts, young mathematicians can practice their graphing skills. Pupils answer questions using graphs and charts but are also challenged to create their own using a given set of data.
Balanced Assessment
Movie Survey
Movie preferences will get your classes talking! Individuals read a pie graph and construct a bar graph using the same information. They then answer questions specific to the data and sample size.
CK-12 Foundation
Mixed Numbers in Applications: Sharing a Chocolate Bar
The advantage of a virtual chocolate bar: it never melts. Learners use an interactive to share a chocolate bar among friends. Some challenge questions assess understanding of fractions in relation to this context.
Curated OER
Learning to Make Bar Graphs
Students construct bar graphs using the results from various experiments. In this graphing lesson, students review data from a previous experiment and demonstrate how to construct a bar graph. Students use a checklist to ensure...
Curated OER
Bar Graph Lesson
Students make a bar graph. In this graphing lesson plan, students discuss why bar graphs are used and are shown bar graph examples. Students create their own bar graph to compare the heights of different things around the world. Students...
Curated OER
Bar Graphs
In this bar graphs worksheet, students, working with a partner, explore how to read and analyze the five answers to one mathematical bar graph.
Curated OER
Use a Bar Graph
In this bar graph worksheet, students use a given bar graph to answer a set of 3 questions. Answers included on page 2.A reference web site is given for additional activities.
Other popular searches
- Fraction Bars
- Hershey Fraction Bars
- Fractions With Chocolate Bars
- Candy Bars
- Fractions With Hershey Bars
- Math Comparison Bars
- Measurement Bars
- Fractions Fraction Bars
- Fractions and Fraction Bars
- Hersey Bars
- Integer Bars
- Make Fraction Bars


