Curated OER
Favorite Candy Bar Graph
Students decide on six different types of candy bars to include in a data collection activity. Working in small groups, they survey a target group in a set amount of time. They access a Internet based graphing tool to create a bar graph...
Alabama Learning Exchange
What's Your Favorite Chocolate Bar?
Young scholars complete a math survey. In this math graphs lesson, students complete a survey about their favorite candy bars. Young scholars create different kinds of graphs using Microsoft Excel to show their results.
Curated OER
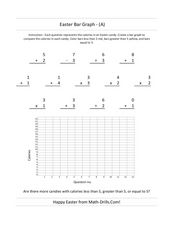
Easter Bar Graph- A
In this Easter math worksheet, students first solve 13 problems with addition, subtraction, multiplication and division. Using the answers, students make a bar graph.
Curated OER
Easter Bar Graph - C
In this math review worksheet, students complete addition, multiplication, division, and subtraction problems where each answer is inserted into a bar graph. Students complete 13 problems.
Curated OER
Easter Bar Graph - (E)
In this math review worksheet, students complete addition, multiplication, division, and subtraction problems where each answer is put into an Easter bar graph. Students complete 13 problems.
Curated OER
Easter Bar Graph - (B)
In this math review worksheet, students complete addition, subtraction, multiplication, and division problems and put their answers into a bar graph that represents calories. Students complete 13 problems and 1 graph.
Curated OER
Easter Bar Graph - (D)
In this math review worksheet, students complete addition, multiplication, division, and subtraction problems where each answer is put into an Easter bar graph. Students complete 13 problems.
Curated OER
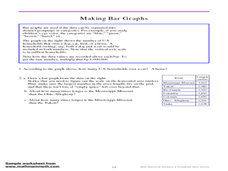
Making Bar Graphs
In this bar graph activity, students answer short answer questions about bar graphs. Students answer 1 question about a bar graph about a cat, and 3 questions about a bar graph about U.S. rivers.
Curated OER
Histograms and Bar Graphs
Students are introduced to histograms, bar graphs, and the concept of class interval. They use an activity and three discussions with supplemental exercises to help students explore how data can be graphically represented (and...
Curated OER
Use Information in Line, Bar, Circle, and Picture Graphs to Make Comparisons and Predictions
Eighth graders explore the concept of graphs. In this graphs lesson, 8th graders compare and contrast picture graphs, bar graphs, line graphs, and circle graphs. Students examine each type of graph and answer questions and make...
Curated OER
Bar Charts and Pictographs: How can they help us?
First graders work with manipulatives to solve various math problems by using concrete objects to solve a list of problems . They create and evaluate bar graphs and write a statement about the information on their bar graph.
Curated OER
Study Buddies - Bar Graphs
In this data collection worksheet, students work with a partner to make 3 small bar graphs after finding the proper number of circles on the first page. They look at a page of a variety of shapes and separate the circles into black,...
Curated OER
Interpreting a Bar Chart
In this interpreting bar charts worksheet, students examine a bar chart that shows how many people traveled on boats that took them out dolphin watching. They answer 8 questions about the times and number of people on the boats.
Curated OER
Frequency Histograms, Bar Graphs and Tables #3
In this frequency histograms worksheet, students examine bar graphs, histograms and tables. They identify the model of information that best matches the statistics. This three-page worksheet cotnains two multiple-choice problems. ...
Curated OER
Problem Solving Application: Using a Bar Graph
For this bar graph worksheet, students use a set of 2 bar graphs to answer 6 related questions. Answers are included on page 2. A reference web site is given for additional activities.
Curated OER
Bar Graph: Vacation Fun
In this bar graph learning exercise, students use a bar graph showing pictures taken on a vacation to complete 6 related questions. Answers are included on page 2.
Curated OER
Create a Bar Graph
In this bar graph activity, students use a set of clues about favorite types of books to draw the bars on a graph. Answers are included on page 2.
Curated OER
Mean, Mode and Bar Graphs
In this mean, mode and bar graphs worksheet, 5th graders analyze the data given, then answer three questions about a bar graph and the data shown.
Curated OER
Bar Graphs and Pie Charts
Fourth graders explore their interest and strengths and display them using a bar graph and pie chart.
Curated OER
Making a Bar Graph
In this bar graph worksheet, students analyze a data table and bar graph depicting information about stickers collected. Students answer 5 questions about the data displayed.
Curated OER
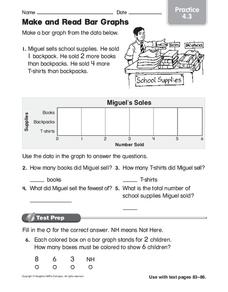
Make and Read Bar Graphs
For this bar graphs worksheet, students make a bar graph about the sale of school supplies with the data presented in one story problem.
Curated OER
Temperature Bar Graph
Students explore mean, median and mode. For this math lesson, students analyze temperature data and figure the mean, median, and mode of the data. Students graph the data in a bar graph.
Curated OER
Simple Bar Graphs Using Excel
Students create original survey questions, and develop a bar graph of the data on paper. They input the survey data using two variables onto an Excel bar graph spreadsheet.
Other popular searches
- Fraction Bars
- Hershey Fraction Bars
- Fractions With Chocolate Bars
- Candy Bars
- Fractions With Hershey Bars
- Math Comparison Bars
- Measurement Bars
- Fractions Fraction Bars
- Fractions and Fraction Bars
- Hersey Bars
- Integer Bars
- Make Fraction Bars


