DK Publishing
Using Information in Tables
Find out how well can your second or third graders use tables to solve word problems by assigning this single-page worksheet. Two tables with different sets of data prompt learners to solve six problems. An example at the top of the page...
Baylor College
Global Atmospheric Change: The Math Link
Change up the classroom atmosphere with this interdisciplinary resource. Following along with the children's book Mr. Slaptail's Curious Contraption, these math worksheets provide practice with a wide range of topics including simple...
Curated OER
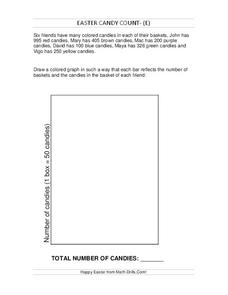
Easter Candy Count
In this bar graph worksheet, learners fill in the bar graph with the information of Easter candy that each child has and find the total. Students fill in 6 bars in the bar graph.
Curated OER
Easter Candy Count
In this bar graph worksheet, students fill in the bar graph based on the information about Easter candy that each child got. Students complete 6 spaces in the bar graph and find the total number of candies.
Curated OER
Introductory Algebra Chapter 3 Review
In this math worksheet, students find the solutions to the problems while interpreting the line, bar, and circle graphs. The examples are given to help in the context of each objective.
Curated OER
Easter Candy Count
In this bar graph activity, students complete a bar graph based on the information of Easter candy they are given for each color. Students complete 6 spaces in the bar graph and find the total.
Curated OER
Easter Candy Count
In this bar graph activity, students complete a bar graph based on the information of Easter candy they are given for each color. Students complete 6 spaces in the bar graph and find the total.
Curated OER
Choosing the Best Graph
In this mathematics worksheet, 6th graders use a line graph to illustrate how a measure of data changes and explain their reasoning. Then they use a bar graph to compare pieces of data and a pictograph to compare data.
Curated OER
Using Data
In this analyzing data activity, 4th graders read, study and interpret a bar graph on how many hours Millie spends a week drawing each day. Students answer 2 short answer questions relating to the bar graph.
Curated OER
Match Game: Enrichment
In this solid figures worksheet, students choose a shape from the box that fits the bar graph totals for the faces, edges, and vertices. Students then complete the last bar graph using the one unused shape.
Curated OER
Problem Solving: Use a Graph: Problem Solving
For this bar graph worksheet, students read the word problem and use the bar graph to complete the problem solving questions for understand, plan, solve, and look back.
Curated OER
Deciding Which Type of Graph is Appropriate
In this graphing instructional activity, students read about line, bar, and pie graphs and then determine which graph is the best way to express data results. This instructional activity has 3 short answer questions.
Curated OER
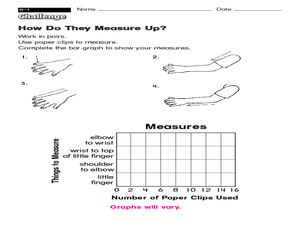
How Do They Measure Up? Measure and Graph
In this measure and graph worksheet, students use paper clips to measure various lengths shown, then bar graph their results, a total of 4 measurements.
Curated OER
Ice Cream Scoop
In this data display worksheet, students write 6 flavors of ice cream on pieces of paper. Students choose papers one at a time and keep track on a tally sheet. Students make a bar graph of the results.
Curated OER
Graph Made Easy: Post Test
In this graphs worksheet, students answer multiple choice questions about line graphs and bar graphs. Students answer 10 questions total.
Curated OER
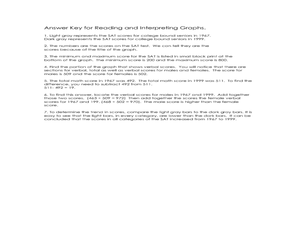
Reading and Interpreting Graphs Worksheet
In this bar graphs instructional activity, students read and interpret a bar graph on SAT scores by answering short answer questions. Students complete 7 questions total.
Curated OER
M&M's Candies Worksheet Graph
In this graphing worksheet students will record data on a bar graph. Students will take a bag of M&M's and chart the colors they find inside this bag.
Curated OER
Statistical Inquiry
In this statistical inquiry worksheet, students analyze and interpret a variety of diagrams such as a scatter plot, bar graph and pie charts. They create tables and other diagrams to support given data. This two-page worksheet contains 3...
Curated OER
7th Grade Math Worksheet
In this integers worksheet, 7th graders solve 10 different problems that include various types of integers and graphs. First, they determine the sum of 3 consecutive integers. Then, students find the ratio between 2 areas of similar...
Curated OER
Organizing Data
In this data worksheet, learners convert measurements to significant notation and determine the number of significant digits. This worksheet has 4 fill in the blank and 2 short answer questions.
Curated OER
Easter Candy Count
In this bar graph worksheet, students complete a bar graph based on the information of Easter candy they are given for each color. Students complete 6 spaces in the bar graph and find the total.
Curated OER
Professor Panda's Pizza Graph
For this data analysis worksheet, students answer 11 questions using a bar graph that was constructed from the answers to a survey about pizza toppings. They use a secret code to determine the best place to have a pizza.
Curated OER
John's Trucking - Who Drove the Farthest
For this bar graph worksheet, students fill in a chart of who drove the furthest each day of the week based on a bar graph. Students complete the chart and answer 2 questions.
Curated OER
Graphing Worksheet: Favorite Sports
In this graphing instructional activity, students analyze a bar graph in which favorite sports are displayed. Students answer 8 questions about the graph. Note: The bars in the graph are shaded in different colors.
Other popular searches
- Fraction Bars
- Hershey Fraction Bars
- Fractions With Chocolate Bars
- Candy Bars
- Fractions With Hershey Bars
- Math Comparison Bars
- Measurement Bars
- Fractions Fraction Bars
- Fractions and Fraction Bars
- Hersey Bars
- Integer Bars
- Make Fraction Bars


