Virginia Department of Education
Transformation Investigation
Graph it! Investigate transformations with a graphing calculator. Pupils graph sets of linear functions on the same set of axes. They determine how changes in the equation of a linear function result in changes in the graph.
Curated OER
Sunshine Math-1
In this math skills instructional activity, students answer 7 questions in which they use various basic math skills. They use number lines, charts, number blocks, a calendar and a ruler to complete this instructional activity.
Curated OER
Reading Graphs
In this reading graphs practice worksheet, students examine a graph and respond to 5 questions that require them to record the coordinates of 5 shapes on the gridded graph.
Curated OER
Great Graphing
Students collect data, use a computer spreadsheet program to create various graphs, and compare the graphs. They state the findings of each graph in writing and decide which graph type best represents the data.
Curated OER
Charts and Graphs
Fifth graders interpret data into graphs and percentages. In this organizing data instructional activity, 5th graders discuss bar, circle and line graphs. Students complete bar graph and apply probability using the results.
Curated OER
Graphing Using Excel
Fifth graders complete a series of graphs by gathering information and using Excel to graph the information. For this graphing lesson, 5th graders graph favorite desserts of the class. Student put their results into the computer and...
Curated OER
Creating a Spreadsheet and Graph
Students create graphs in Excel. In this spreadsheet lesson, students input data into spreadsheet cells then use the graphing feature of the Excel program to produce colorful graphs of the data. The directions to create the graph are...
Curated OER
Basic Limits
Learners calculate the limits of functions. In this calculus lesson, learners find the left and right handed limits of different functions. They use the Ti Navigator to drag the function around as they study limits.
Curated OER
Parallel and Perpendicular Lines
Young geometers get some solid skills practice in evaluating slopes. Beginning with the basics of slope through two points and progressing through properties of parallel and perpendicular lines, the building of skills is gradual and...
Curated OER
Kids/Blocks/Learning
Help develop graphing skills in your young learners.. They create a picture graph, represent 1:1 correspondence, represent same and different, and draw conclusions. They write an experience story about the conclusions drawn from the...
Learner
Solid Shapes
A collection of two lessons, kindergartners will identify two-dimensional shapes in solid shapes. They will develop basic knowledge of the components that make up a sphere, rectangular prism, pyramid, cylinder, cone, and cube. Young...
Virginia Department of Education
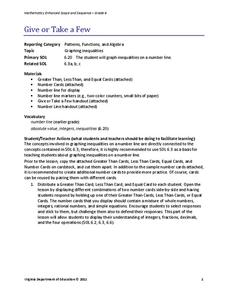
Give or Take a Few
Young mathematicians extend their knowledge of rational numbers on a number line to graph inequalities by first using number cards to compare rational numbers. They finish by using similar reasoning to graph inequalities on a number line.
CK-12 Foundation
Horizontal Translations or Phase Shifts: Tangent
Patterns can be shifty! Find the pattern when shifting the graph of tangent. Pupils move the graph of tangent to different locations on the coordinate plane. They observe what happens to the function and its vertical asymptotes before...
CK-12 Foundation
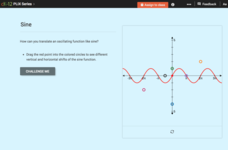
Horizontal Translations or Phase Shifts: Sine
Shift a trigonometric function and find its new equation. Pupils translate a sine function on a graph. The scholars determine the equation of the function that represents the translated graph and observe the connection between a...
CK-12 Foundation
Horizontal Translations or Phase Shifts: Cosine
If cosine is shifted, how is its equation affected? Learners manipulate the graph of cosine by moving the y-intercept to different locations on the coordinate plane. Pupils determine the new equation that models the shifts.
CK-12 Foundation
Horizontal Translations or Phase Shifts: Horizontal and Vertical Translations
It is all about the shift. Pupils translate the graph of a cubic function to different marked locations on the plane and determine the new equation that represents the shifts. The activity is designed to encourage individuals begin to...
CK-12 Foundation
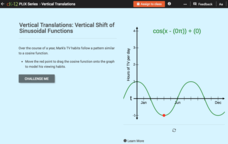
Vertical Translations: Vertical Shift of Sinusoidal Functions
Create a shift in TV viewing habits. The interactive presents a cosine model of an individual's TV viewing habits during a year. Class members move the model to reflect given conditions. Finally, they determine key features from the...
CK-12 Foundation
Checking Solutions to Inequalities: Apples and Bananas Shopping Excursion
Go bananas over a fun interactive! Learners drag a point on a virtual graph of an inequality to see if it is a solution. This helps determine the possible numbers of apples and bananas a shopper can buy with a given amount of money.
CK-12 Foundation
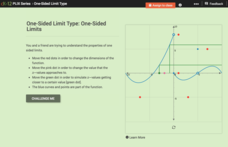
One-Sided Limit Type: One-Sided Limits
Not everything that's one-sided is bad. A slider interactive aids learners in investigating one-sided limits from graphs. A set of challenge questions assesses their understanding of the relationship between one- and two-sided limits.
CK-12 Foundation
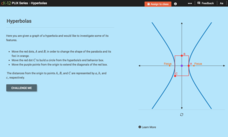
Hyperbolas
Hyperbolas—practice thinking outside of the box. Pupils alter the end behavior box to create various graphs of hyperbolas. They determine formulas to find the distance from the origin to the foci. Using that information, scholars...
Mathematics Assessment Project
Arithmetic with Polynomials and Rational Expressions
It all starts with arithmetic. An educational resource provides four items to use in summative assessments. The items reflect the basic skill level required by the standards in the domain and are designed to have pupils reason abstractly...
Polar Trec
Global Snow Cover Changes
Snow is actually translucent, reflecting light off its surface which creates its white appearance. Pairs or individuals access the given website and answer questions about snow cover. They analyze graphs and charts, examine data, and...
CK-12 Foundation
Frequency Tables to Organize and Display Data: Favorite Films
What information can your class determine if they know the number of people attending movie showings? Using the information about the number of people at each screening, learners develop a frequency table. The pupils analyze the type of...
Curated OER
RCX Car Line Graph
Students develop a line graph based on distances that an RCX car drives in specified amounts of time. They then are given a specific amount of time for the car to drive and be asked to extrapolate the car's distance from the graph.


