Alabama Learning Exchange
Finding Prime
Fifth and sixth graders explore prime numbers. They work with a partner to build rectangular arrays using twelve tiles. Factor pairs are noted and recorded on graph paper. Pupils construct rectangular arrays with a prime number and...
Curated OER
Student News And Weather Channel
Fabulous! Your 5th graders should love this project. As an ongoing lesson throughout the year students use temperature probes to record outside temperature and then document their data using spreadsheets. They use their weather data and...
Curated OER
Morning Math / Homework Math
For this math worksheet, students complete ten exercises reviewing basic math skills related to place value, money, time, number sense, and graphing. A Homework Math sheet is also included reviewing the same skills.
Curated OER
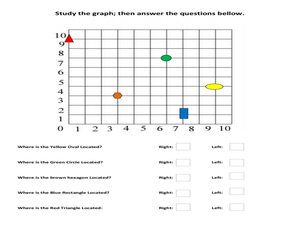
Graph Study
For this geometry skills worksheet, students examine a graph and respond to 5 questions that require them to identify the coordinate pairs of object on the grid.
Curated OER
Twelve Days of Christmas--Prediction, Estimation, Addition, Table and Chart
Scholars explore graphing. They will listen to and sing "The Twelve Days of Christmas" and estimate how many gifts were mentioned in the song. Then complete a data chart representing each gift given in the song. They also construct...
Curated OER
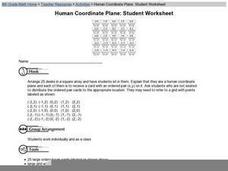
Human Coordinate Plane: Student Worksheet
An excellent way to teach the basics of coordinate graphing is here for you! Young mathematicians take on the identity of one of the two numbers in a coordinate pair, and the entire class must arrange themselves in the proper order. This...
Beacon Learning Center
Line Plots
Introduce line plots, show examples of tables, graphing on a number line, and engage in a class discussion. Share the process by which statistical data is organized and displayed on a number line. Examples and worksheets are included....
Institute of Electrical and Electronics Engineers
Rotational Equilibrium
Physics stars design mobiles that demonstrate rotational equilibrium. They take measurements and solve related equations for force by graphing, substitution, or determinants. This is a well-developed lesson plan, complete with student...
National Wildlife Federation
Get Your Techno On
Desert regions are hotter for multiple reasons; the lack of vegetation causes the sun's heat to go straight into the surface and the lack of moisture means none of the heat is being transferred into evaporation. This concept, and other...
Science 4 Inquiry
Atmospheric Layers
Space diving refers to the act of jumping from outer space and falling through Earth's atmosphere before parachuting to land. Scholars learn about this extreme activity and study the layers of the atmosphere they must conquer in the...
Curated OER
Games on Echolocation
Get a little batty with life science! This fun simulation game replicates how bats use echolocation to hunt moths in their native Hawaiian habitat. After creating blind folds and discussing some basic principles of echolocation, learners...
Curated OER
Reading Graphs
Students plot functions on the Cartesian coordinate plane. They explore lines and parabolas. Students analyze graphs and answer questions about the information presented on the graph using an online program.
Curated OER
Coordinate Graphs
Students use coordinate graphs in order to identify objects and their locations. They are shown how to plot the x and y coordinates and then are given values to be plotted during guided and independent practice. Students are assessed on...
Curated OER
Gummy Bear Math
First graders predict, collect data, and create a graph based on gummy bear colors they are given. In this graphing lesson plan, 1st graders first predict how many colors of gummy bears there are. They then count the colors, graph them,...
Curated OER
Functions and the Vertical Line Test
Students examine functions and function notation. They use computer activities to discover how to graph functions, and conduct a vertical line test. Students describe spatial relationships using coordinate geometry.
Curated OER
M & M Madness
Students work with the mathematics unit of collection, organization, and presentation of data. In this math and technology lesson plan, students use Valentine M & M’s and The Graph Club to sort and graph the various colored M & M’s.
Curated OER
Earth Energy Budget Pre Lab
Students explore energy by conducting an in class experiment. In this climate change lesson, students conduct a water vapor experiment in a soda bottle. Students utilize graphs and charts to analyze the results of the experiment and help...
Curated OER
Mapping the News
Students explore cartography. For this map skills and map making lesson, Students work in groups to create wall size world maps including legends, compass roses, latitude and longitude, and physical features. Students collect current...
Curated OER
Conversation Starters
For this basic present simple verbs worksheet, 1st graders, working in teams of two or four, ask a set of questions in order to complete a graph on a variety of information to fill in a type of "information gap" chart.
Curated OER
Mathematical Modeling
Study various types of mathematical models in this math lesson plan. Learners calculate the slope to determine the risk in a situation described. They respond to a number of questions and analyze their statistical data. Then, they...
Curated OER
Cutting Corners - Parts 1 and 2
Students use optimization concepts to design their own container. In this optimization lesson plan, students understand how the optimization concept is critical in calculus and why products are packaged the way they are.
Los Angeles County Office of Education
Assessment for the California Mathematics Standards Grade 5
Test young mathematicians' knowledge with an assessment aligned to California's fifth grade state standards. The exam covers a multitude of concepts including fractions and decimals, positive and negative numbers, measurement; and how to...
University of Colorado
Distance = Rate x Time
Every year, the moon moves 3.8 cm farther from Earth. In the 11th part of 22, classes use the distance formula. They determine the distance to the moon based upon given data and then graph Galileo spacecraft data to determine its movement.
Willow Tree
Line Plots
You can't see patterns in a jumble of numbers ... so organize them! Learners take a set of data and use a line plot to organize the numbers. From the line plot, they find minimum, maximum, mean, and make other conclusions about the data.


