Curated OER
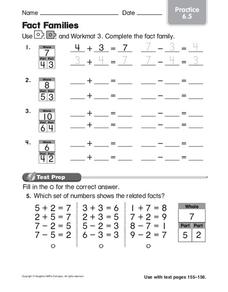
Fact Families
In this fact family worksheet, 1st graders complete 4 sets of blanks that show addition and subtraction fact families. They examine 3 sets of numbers and determine which one shows the fact families that go with the numbers 5, 2, and 7.
Curated OER
Graphing and the Coordinate Plane
Students gain practice reading coordinates and plotting points by participating in the Coordinates! Game. They demonstrate and test their skills with graph paper and the Maze Game.
Virginia Department of Education
Transformation Investigation
Graph it! Investigate transformations with a graphing calculator. Pupils graph sets of linear functions on the same set of axes. They determine how changes in the equation of a linear function result in changes in the graph.
Curated OER
pH Testing
Young scholars explore the use of variables in the scientific method. They identify the dependent and independent variables through pH testing. Students construct graphs of their data and analyze their findings.
Curated OER
Mathematical Modeling and Physics
Twelfth graders use a web site to investigate roller coaster physics. In this mathematical modeling lesson, 12th graders are grouped according to their performance on a test. Each group is given an activity to complete on a web site...
Curated OER
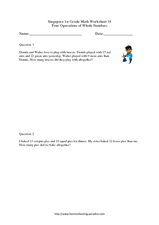
Four Operations of Whole Numbers
In this four operations of whole numbers worksheet, students complete word problems containing all four operations of whole numbers. Students complete 20 problems.
Curated OER
Trail Mix
Fifth graders solve a math word problem using previous knowledge of fractions and basic addition in this short lesson for the 5th grade classroom. The lesson can be used as practice for state and national tests that require problem...
Curated OER
Math: How Many Ways Can You Find the Middle?
Twelfth graders find the mean, median, and modes of stacks of Lego blocks, They search in newspapers for real life applications of them. They present oral reports on what they have learned.
Curated OER
Timed Multiplication Test Graphs
Students use the tools of data analysis for managing information. They solve problems by generating, collecting, organizing, displaying histograms on bar graphs, circle graphs, line graphs, pictographs and charts. Students determine...
Curated OER
Math & Social Science
Young scholars are given data and are to calculate averages and yearly totals of how many cars travel the Tacoma Narrows Bridge. They also make a graph of the data.
Curated OER
Acids, Bases, and pH
Young scholars investigate acids, bases,and pH. They test the acidity and basicity of various household items using litmus paper. Using their results, they rank the substances according to pH and identify the contributing chemical on the...
Curated OER
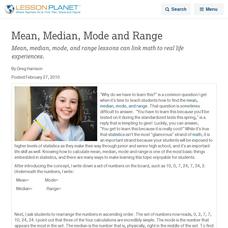
Mean, Median, Mode and Range
Mean, median, mode, and range lessons can link math to real life experiences.
Curated OER
Linear Inequalities in Two Variables
Graph and solve linear equations in two variables. The class relates the concepts of linear equations to the real world.
Curated OER
Points, Lines, Planes, and Space
In this points, lines, planes, and space worksheet, students solve word problems dealing with points, lines, planes, and space. Students complete 20 individual problems and 20 group problems.
Curated OER
Telling Time Lesson Plan
Judy Clocks are a great invention. Here, learners review telling time to hour and half hour on Judy clocks, begin telling time to quarter hour, use clock stamps to practice, and play computer games using Trudy's Time and Place House...
Curated OER
We All Scream for Ice Scream
High schoolers explore the formulas for volume of three-dimensional objects. They participate in various activities involving ice cream, ice cream cones, small candies, and gum balls, recording their calculations on a lab sheet.
Curated OER
Conditional Probability and Probability of Simultaneous Events
Your statisticians examine the characteristics of conditional probability and the probability of simultaneous independent events. They perform computer activities to find probabilities for simple compound events. They examine the...
American Statistical Association
Exploring Geometric Probabilities with Buffon’s Coin Problem
Scholars create and perform experiments attempting to answer Buffon's Coin problem. They discover the relationships between geometry and probability, empirical and theoretical probabilities, and area of a circle and square.
Willow Tree
Line Plots
You can't see patterns in a jumble of numbers ... so organize them! Learners take a set of data and use a line plot to organize the numbers. From the line plot, they find minimum, maximum, mean, and make other conclusions about the...
Radford University
Parallel Lines, Transversals, and Angles: What’s the Connection?
Streets, bridges, and intersections, oh my! Parallel lines and transversals are a present in the world around us. Learners begin by discovering the relationship of the angles formed by parallel lines and a transversal. They then...
Curated OER
Perimeters: Which Constellation is the Longest?
High schoolers use diagrams of the constellation Orion and the constellation Ursa Major which show the distances between the stars of the constellations. They calculate the perimeters of each, find the average distance of the stars for...
Curated OER
Let's Plot Points
Use coordinate grid paper to plot points and identify shapes that are already plotted on the paper by saying their coordinates. Pupils also measure the distance between points and play the game Battleship. There are several web links and...
Curated OER
Time That Period
Physical science starters play with a pendulum in order to experience periodicity. Detailed procedures and a worksheet are included for day one. For day two, learners will use a graphing calculator to help them plot orbit data from a...
Curated OER
Sitting across from Each Other
What is the probability that two randomly seated people will be across from each other at a square table? Check learners' understanding of theoretical probability and compound events with this short assessment. A great opportunity to...


