National Council of Teachers of Mathematics
National Debt and Wars
Take a functional approach to the national debt. Learners collect information about the national debt by decade and plot the data. They determine whether an exponential curve is a good fit for the data by comparing the percent changes...
Kenan Fellows
Saving Those Who Save Us: Exploring the Use of Sensors with Data Visualization
Sensor technology is amazingly accurate and useful. Combining the sensor technology and mathematical knowledge, scholars design experiments to answer a question they have developed. Questions may focus on light sensing, temperature...
Curated OER
An Introduction to Functions
Students investigate the growth and decay of an exponential function. In this algebra instructional activity, students apply properties of exponent solve problems. They identify any patterns they see in the graphs.
Curated OER
Teaching About the Properties of Water
Students use video, Internet research, graphs and tables, worksheets and hands-on experiments to investigate the properties of water in a lake environment. They work under direction or through an inquiry process.
Curated OER
Break Even Analysis and Budgeting
Students analyze the use of break even charts in business planning. They examine the purpose and nature of budgets. They explore price elasticity and how to use Excel spreadsheets to manipulate financial information.
Curated OER
Discovering Growth Patterns
Students explain the differences between linear (arithmetic) and exponential (geometric) growth. They use worksheets imbedded in this lesson to help them make predicitions and graph data points.
Curated OER
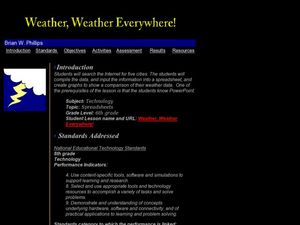
Weather, Weather, Everywhere!
Sixth graders collect weather data to compare temperatures around the world. Using the Internet, learners collect data, put it into spreadsheets, and analyze and graph the results. An interesting way to cover the topic of weather.
Curated OER
It's In The Chocolate Chips
Students investigate which brand of chocolate chip cookies contains the most chocolate. They analyze and compare data using Microsoft Word and Microsoft Excel. They communicate the results with Microsoft PowerPoint.
Curated OER
There's No Accountin with Ledgers
Tenth graders create and maintain a ledger, write an essay for the process, and learn to keep financial accounts through the ledger. In this ledger lesson, 10th graders define an accounting ledger and create one for the money they've...
Curated OER
Teaching about Data Interpretation
High schoolers explore a variety of relevant lake water chemistry questions, compose responses, and present their results in a poster format. They, in pairs, answer questions about lake chemistry which are imbedded in this plan.
Curated OER
My Community
First graders design a Powerpoint presentation to reflect information about their community. In this community lesson, 1st graders create slides to explain the weather, geography and other information about the city.
Curated OER
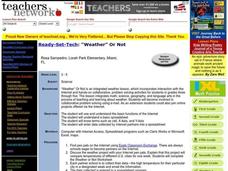
Weather Or Not
Students use the internet to find pen pals to share in their weather experiment. Individually, they research the high and low temperatures for cities within the United States and email the results to their pen pal. They also develop a...
Curated OER
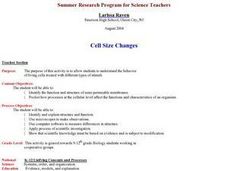
Cell Size Changes
Students examine the behavior of living cells treated with different types of stimuli. They watch an online movie, examine wet mount slides under a microscope, take an online quiz, and analyze data.
Curated OER
Earth Energy Budget Pre Lab
Students explore energy by conducting an in class experiment. In this climate change lesson, students conduct a water vapor experiment in a soda bottle. Students utilize graphs and charts to analyze the results of the experiment and help...
Curated OER
Reaching the Solar System
Students sing the Rap of the Solar System, view pictures of the planets, and calculate their weights and ages on all the planets and the sun. They create a presentation comparing themselves with a planet or object in the solar system.
Curated OER
Phenomenal Weather-Related Statistics
Eighth graders research, collect and interpret data about weather statistics. They record that data on spreadsheets. they create Powerpoint presentations on their individual or group research.
Curated OER
Slopes, Hopes, & Speed
Students investigate the sport of skiing through Internet research in this multi-task lesson. They compare and generalize the results of five individuals by using mean, median, and mode.
Curated OER
Solving Polynomial Equations
Students demonstrate how to use spreadsheets as a tool for analyzing, visualizing and solving mathematical problems. Students obtain fundamental grasp of cubic equations and other polynomial equations.
Curated OER
Menu Math
Students follow the food pyramid to create a daily food budget. They research food prices online or in newspapers. They graph the amount of each food group included in their menus. They can also create a weekly food menu based on a fixed...
Curated OER
Compare 2-D Shapes
Second graders examine the attributes of two-dimensional shapes. In this geometry lesson, 2nd graders play a game in order to identify two-dimensional shapes and to name them.
Curated OER
Compare 2-D Shapes
Second graders explore and analyze plane shapes. In this plane shapes lesson, 2nd graders evaluate shape attributes to classify shapes correctly. Students work in groups to create different shapes.
Curated OER
State Economy Chart
Fifth graders create a 3D Pie graph using the Chart Wizard in Excel to represent their assigned states' data. They discuss the similarities and differences between states, and form a hypothesis on the relationship between location and...
Curated OER
Drive-Thru Nutrition
Students research fat and calorie content of various food items at 12 popular fast-food restaurants. They compare the foods and create a day's worth of healthy menus using food from those restaurants.
Curated OER
You want me to do what with this Dirt?
Eighth graders explore how to take soil samples and use GPS to determine the location of the site they have chosen to take the samples.


