University of North Carolina
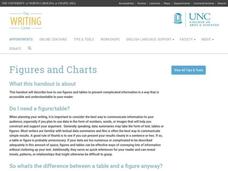
Figures and Charts
Sometimes words aren't the best way to get information across to the reader. The eighth handout in the 24-part Writing the Paper series describes different type of figures and charts to display complex information in a paper....
Mathed Up!
Pie Charts
Representing data is as easy as pie. Class members construct pie charts given a frequency table. Individuals then determine the size of the angles needed for each sector and interpret the size of sectors within the context of frequency....
World Wildlife Fund
Bar Charts & Pie Charts
Learn about life in the Arctic while practicing how to graph and interpret data with this interdisciplinary lesson. Starting with a whole group data-gathering exercise, students are then given a worksheet on which they analyze and create...
World Wildlife Fund
Graphs and Charts
A two-part worksheet incorporating bar graphs and pie charts, young mathematicians can practice their graphing skills. Pupils answer questions using graphs and charts but are also challenged to create their own using a given set of data.
CK-12 Foundation
Pie Charts: Soda Party
Using the interactive, pupils create a pie chart that represents the percentage of sodas bought for a party. Individuals need to determine the percentage and number for the final variety of drinks. The learners determine how the...
Free Printable Behavior Charts
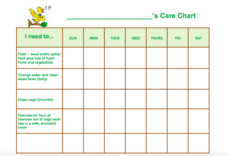
Pet Care Charts
Involve kids in the care of pets at home or in the classroom by assigning tasks using these pet care charts The list of tasks are recorded on a matrix in the left-hand column and the days of the week are indicated in the first row...
Mathed Up!
Tallys and Charts
After watching a brief instructional video, young mathematicians are put to the test. By completing and reading frequency tables, tally charts, and bar graphs, individuals show their understanding of how to interpret data.
Math Worksheets Land
My Favorite Animal At The Zoo Pie Graph
What is your favorite animal at the zoo? Young mathematicians answer eight multiple choice questions, based on a survey of 50 people presented in a pie graph. Additionally, the graph does not display any numbers, but rather...
EngageNY
Interpreting, Integrating, and Sharing Information: Using Charts and Graphs about DDT
Is American growing fatter? Scholars begin with a mini lesson on reading charts and graphs using information about Human Body Fat in United States. They then transfer what they learned to charts and graphs using harmful and...
CK-12 Foundation
Conversions between Degrees and Radians: Charting Hours in the Day
Forget hours, divide the day into radians instead. Class members convert the angles in a pie chart of daily activities into radian measures. They add angle measures for multiple activities then determine a relationship between the radian...
Curated OER
The Mitten
Explore the Ukraine through a reading of The Mitten. Readers will determine the sequence of events, cause and effect, make predictions, and find the main idea of the story. They also use math skills to make charts and graphs. Finally,...
IXL Learning
Small Times Table Reference Charts
Support young mathematicians on their journey to fluent multiplication with these handy reference tables. Small enough to fit in their pockets, these charts allow children to practice their multiplication facts anywhere they go.
Teacher's Guide
Incentive and Behavior Charts
Incentive and behavior charts abound in this packet, which features bears, ladybugs, cars, and fish. Good behavior is rewarded with stickers that kids can place on their "Beary Good Behavior Chart." A beary nice printable.
Teacher's Guide
Holiday Sticker Charts
Templates for Valentine Day, St. Patrick's Day, Halloween, Thanksgiving, and Christmas reward charts are included in this clever resource packet.
Curated OER
Multiplication Charts
This resource consists of a series of three fill in the blank multiplication charts each of which have different missing information to be plugged in. Students need to fill in a total of 90 numbers over the course of these three pages....
Facing History and Ourselves
Identity Charts
Many factors shape the identity of persons, communities, and even nations. Tweens and teens have an opportunity to consider the many aspects of identity as they create a graphic that reflects who they are. Class members first brainstorm...
Curated OER
Lights, Shoals & Soundings
Students explore nautical charts and their symbols, with a bit of fun thrown in.
Curated OER
Logs, Charts, and Journals: What's On Your Plate?
Have your writers identify and use words that appeal to the senses. They create a chart of sensory words and record some of their favorites, then write a journal entry in which they describe eating at a restaurant using sensory details....
Math Worksheets Land
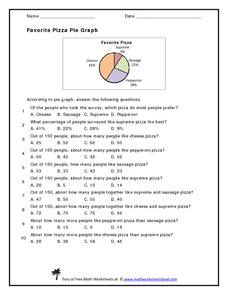
Favorite Pizza Pie Graph
You've heard of a pie graph, but what about a pizza pie graph? Challenge young mathematicians to answer ten questions based on a random survey of people's favorite pizzas. A pie graph displays the percentages of each type of pizza. Some...
Math Worksheets Land
Reading and Making Pie Graphs Worksheets
The opportunities are endless with a collection of five worksheets that enable young mathematicians to read pie graphs. Individuals use graphs to answer eight multiple choice questions on each sheet. The set of five allows for...
Curated OER
Unit VII Energy: WS 1 Qualitative Analysis - Pie Charts
For each of eight diagrams of objects in motion, physics masters draw pie charts to depict the changes in energy. For each they must identify the energy conditions at each position. This is a unique worksheet, perfect for assessing how...
Balanced Assessment
Scale Charts
Develop scales using tables. Pupils complete charts to show equivalent scale factors before using the completed tables to determine the sizes of scale drawings. They finish the lesson and demonstrate their understanding by completing a...
Get Set for School
Capital Formation Chart
Practice makes perfect, especially when it comes to handwriting. These reference charts are excellent support for young children still developing their ability to print upper- and lower-case letters
PBIS World
Tier 1 Intervention General Tracking Form
Looking for a way to compile data based on behavior interventions? This spreadsheet can help you out! You type in up to five behaviors and five interventions and tally whenever a behavior or intervention is used. The spreadsheet...
Other popular searches
- Charts and Graphs
- Multiplication Charts
- Maps and Charts
- Tally Charts
- Pie Charts and Graphs
- Pie Chart
- Multiplication Charts to 100
- Reading Charts and Graphs
- Behavior Charts and Graphs
- Charts and Graphs Candy
- Interpret Charts and Graphs
- Charts and Graphs Christmas


