Curated OER
Bathymetric Mapping
Students draw contour lines based on NOAA soundings on a nautical chart. They color the contours and glue label tags for topographic features. They determine that the floor of the ocean is composed of hills, plains, ridges, trenches,...
NOAA
Wet Maps
How do oceanographers make maps under water? Junior explorers discover the technologies and processes involved in creating bathymetric maps in part three of a five-part series designed for fifth- and sixth-grade pupils. The lesson...
NOAA
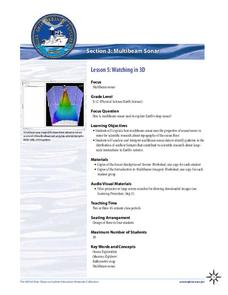
Watching in 3D
Bring the ocean floor to life! Earth science scholars discover the process of deep sea mapping in the third installment in a series of five lessons about ocean exploration. The teacher's guide includes helpful resources, worksheets, and...
Curated OER
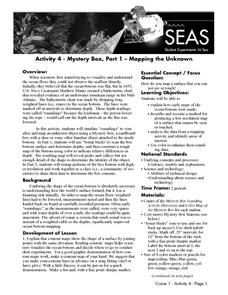
Mapping the Unknown
Learners explain how early maps of the ocean bottom were made. They describe and execute a method for producing a low-resolution map of a surface that cannot be seen or touched. Students analyze the data from a mapping activity and...
Curated OER
Reading Maps of the East Pacific Rise
Students make qualitative and quantitative observations and use various maps to investigate the features of the East Pacific Rise The study actual bathymetric maps of the EPR region. They identify key features of the ridge and explore...
CK-12 Foundation
Ck 12: Earth Science: Bathymetric Evidence for Seafloor Spreading
[Free Registration/Login may be required to access all resource tools.] Describes features of the seafloor and how they are mapped by echo sounding. It touches upon the continental margin as well.


