Curated OER
Water Down the Drain
Did you know that leaky faucets waste $10 million worth of water? Conservationists perform an experiment and draw best-fit lines to explore how the US Geological Society determined this value.
Virginia Department of Education
Linear Modeling
An inquiry-based algebra lesson plan explores real-world applications of linear functions. Scholars investigate four different situations that can be modeled by linear functions, identifying the rate of change, as well as the...
Charleston School District
Pre-Test Unit 9: Scatter Plots
What do your classes know about statistics? Use a pre-test to determine their background. Topics include scatter plots and lines of best fit, two-way frequency tables, and modeling with linear equations.
Curated OER
Graphing and Analyzing
For this graphing and analyzing worksheet, 9th graders first state if each graph represents a linear or nonlinear relationship. Second, they create a difference table for each set of data presented and determine whether it represents a...
Curated OER
Why Are Hot Things Red?
In this radiation and temperature worksheet, learners use 2 methods to derive the Wein Displacement law that shows the relationship between the temperature of a body to the frequency where the Planck curve's value is at its maximum....
Curated OER
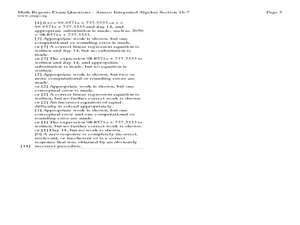
Fourteen Math Regent Exam Statistics Questions on Scatter Plots and Linear Regression
In this linear regression learning exercise, students solve fourteen Math Regent Exam questions regarding scatter plots and linear regression. The solutions are provided.
Curated OER
Strike a Pose: Modeling in the Real World (There's Nothing to It!)
Adjust this lesson to fit either beginning or more advanced learners. Build a scatter plot, determine appropriate model (linear, quadratic, exponential), and then extend to evaluate the model with residuals. This problem uses real-world...
WK Kellogg Biological Station
Plotting Phenology
Finally, a worksheet that involves more than filling in some blanks. Your budding ecologists must graph and analyze three sets of data, then synthesize the information as they think about the impacts of plant reproduction on insects and...
Virginia Department of Education
Logarithmic Modeling
Explore logarithms and logarithmic regression. Young mathematicians first learn about inverse functions and about the logarithm function family. They take their newfound knowledge to use logarithmic functions to model situations and...
Curated OER
Lesson 6-7: Scatter Plots and Equations of Lines
In this scatter plot worksheet, students examine tables and write a linear equation that matches the table. Students graph linear equations. They read scatter plots, determine the trend line, and write a linear equation to...
Inside Mathematics
Scatter Diagram
It is positive that how one performs on the first test relates to their performance on the second test. The three-question assessment has class members read and analyze a scatter plot of test scores. They must determine whether...
Curated OER
Academic Grade 9 Assessment of Mathematics: Algebra I and Geometry
Test your class, or use this 12 page math packet as chapter review. They solve 21 multiple choice problems which require them to graph linear equations, find the volume of prisms and cones, find unknown angles, and determine...
Curated OER
The Big Bang-Hubble's Law
In this Hubble's law activity, students use data for galaxies which include their distance and speed. Students make a graph to show the distance to each galaxy and the speed of each galaxy. They use their graph to answer 4 questions...
Curated OER
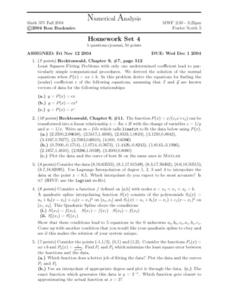
Numerical Analysis: Discrete Least Squares
In this discrete least squares activity, students use a linear algebra approach to discrete last squares approximation. This two-page activity contains approximately 10 problems.
Curated OER
Linear Systems: Least Squares Approximations
In this least squares approximation worksheet, learners use linear algebra to find the least square error and the equation of a line for given points. They find the equation of a parabola through provided points. This four-page...
Charleston School District
Sketching a Piecewise Function
How do you combine linear and nonlinear functions? You piece them together! The lesson begins by analyzing given linear piecewise functions and then introduces nonlinear parts. Then the process is reversed to create graphs from given...
Curated OER
Numerical Analysis: Introduction to Approximation Theory
In this introduction to approximation theory, students compute the slope and intercept of a line. They describe nonlinear relationships. This four page activity contains approximately five problems.
Curated OER
Numerical Analysis: Polynomials
In this polynomial worksheet, students explore functions, determine the least square error, and explore quadratic spline interpolation. This two-page worksheet contains approximately six problems.
Virginia Department of Education
How Much is that Tune?
Tune in for savings! Scholars investigate pricing schemes for two different online music download sites. After comparing the two, they determine the numbers of songs for which each site would be cheaper.
Houston Area Calculus Teachers
Area and Volume
An AP calculus lesson begins with an activity to determine the volume of a solid using a cross-section. Next, learners review the ways to find the area between two curves , as well how to find the volume of a solid created...


