Curated OER
Density of Pennies Lab
In this density of pennies worksheet, student conduct an experiment to determine the metals used in the core of pennies made after 1983. Students design their own experiments using a balance and graph paper to determine the density of...
Curated OER
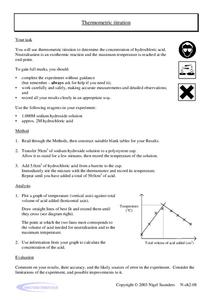
Thermometric Titration
In this thermometric titration worksheet, students titrate hydrochloric acid with sodium hydroxide to determine the concentration of hydrochloric acid. They measure the change in temperature of the solution, plot their data and use the...
Curated OER
How Hot is that Star?: Astronomy, Sun, Solar Temperature, Science
Students explain sun facts and solar information. They discover how temperature of a star is measured. They investigate the various scales used to measure temperature. They observe images of the sun. They classify stars according to te
Curated OER
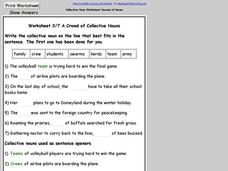
Worksheet 2/7 on Collective Nouns
In this recognizing collective nouns worksheet, students use collective nouns in a word bank to fill in the blanks in sentences. Students write 7 answers.
Curated OER
Handling Data: Representing Date - Online Version
Here is an online lesson plan on data representation. In it, learners access websites embedded in the plan which lead them through a variety of activities around data representation and statistics. The activities are quite good, and...
Sargent Art
Picasso and Beyond!
After reviewing the life and art of Pablo Picasso, learners set out to create abstract, cubist, relief portraits. They'll draw, color, paint, and cut out portraits just like the ones Picasso created. The lesson is extremely well written...
West Contra Costa Unified School District
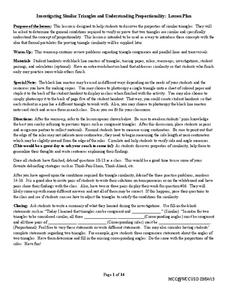
Investigating Similar Triangles
Let your use of the resource be in proportion to its usefulness. Pupils investigate similar triangles by measuring side lengths and considering given angle measures. The results of the investigation help develop generalizations about...
Curated OER
Measuring our Hands!
How do we compare? Get your scholars measuring using this interactive and kinesthetic math activity. First, learners compare something (you announce- could be index finger, palm, feet, etc.) to classmates. Consider having them record...
Curated OER
Tiling the Classroom
Students see how to identify regular polygons, how to slide, turn and flip polygons, and why certain polygons tessellate better than others. Groups create a one foot square design to be used to tile the classroom. Great instructional...
National Endowment for the Humanities
La Familia
Young scholars identify at least one country where the Spanish language is spoken, describe similarities and differences between Spanish, Mexican, and Puerto Rican families, and practice speaking the Spanish words for several family...
Curated OER
Books for Teaching "All About Me!"
Young scholars learn about experiences and feelings through books. In this lesson, students read a variety of books to aid in their understanding of life. Through a listing and brief synopsis of twelve books, young scholars explore...
Curated OER
Viewing Tubes
Students complete a lab in order to discover if the length of a viewing tube, its diameter, or the distance from an object affect the type of data collected and the resulting graph.
Curated OER
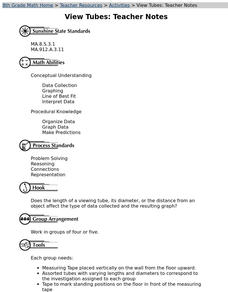
View Tubes
Eighth graders decide if the length of a viewing tube, its diameter, or the distance from an object affects the type of data collected and the resulting graph through a series of experiments.
Curated OER
Human Evolution
Young scholars make and use observations of Laetoli footprints to provide clues to life in the past. They collect and analyze data to study the relationship between foot length and body height.
Curated OER
Measuring Mania
Pupils rotate through stations in the classroom, completing different types of measurements. These measurements are placed into a spreadsheet, and a scatter plot is generated. They type an explanation of their results in correlation with...
Curated OER
Trends in Precipitation
Eighth graders study about precipitation and graph the information. They look for patterns in a scatter graph and make inferences based on what they see. They need to see a relationship between location and the amount of precipitation.
Curated OER
Gender and Income
Students investigate Income and gender preference. In this statistic lesson, students collect data of Income to see if one gender makes more than the other. Students examine the data and draw conclusions.
Curated OER
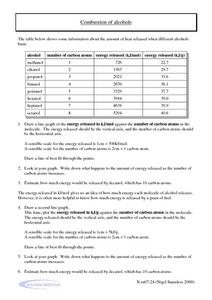
Combustion of Alcohols
In this combustion worksheet, learners use a table showing the amount of heat released when different alcohols burn to complete 2 problems. Students create 2 graphs plotting the energy release against the number of carbon atoms.
Curated OER
Optimization For Breakfast
Students identify he proportion of a cereal box. In this algebra lesson, students define the relationship between patterns, functions and relations. They model their understanding using the cereal box.
Curated OER
Move It
Studens collect and graph data. In this algebra lesson, students use a CBL and CBR with a TI Calcualtor to observe linear graphs. They use the correct vocabualry as they discuss the collected data.
Curated OER
Beginning Modeling for Linear and Quadratic Data
Students create models to represent both linear and quadratic equations. In this algebra instructional activity, students collect data from the real world and analyze it. They graph and differentiate between the two types.
Curated OER
Numerical Analysis: Discrete Least Squares
For this discrete least squares worksheet, students use a linear algebra approach to discrete last squares approximation. This two-page worksheet contains approximately 10 problems.
Curated OER
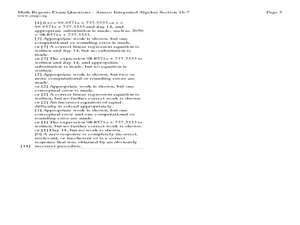
Fourteen Math Regent Exam Statistics Questions on Scatter Plots and Linear Regression
In this linear regression learning exercise, students solve fourteen Math Regent Exam questions regarding scatter plots and linear regression. The solutions are provided.
Curated OER
Relating Distance and Velocity Over Time
Students calculate the distance and velocity over time. In this algebra instructional activity, students graph a linear function to represent the distance vers time travel. They interpret their graphs and draw conclusion.
Other popular searches
- Line of Best Fit
- Lines of Best Fit
- Math Best Fit Line
- Best Fit Linear Data
- Algebra Line of Best Fit
- Best Fit Line Worksheets
- Best Fit Linear Data"
- Correlation Best Fit Lines
- Graphing Best Fit Linear Data


