Curated OER
Calculator-Based Lessons Help Examine Real-World Data
Students may determine equations based on graphs and regression models.
Alabama Learning Exchange
The Composition of Seawater
Students explore the concept of finding the composition of seawater. In this finding the composition of seawater instructional activity, students make a saturated salt water solution. Students discuss why there is variation...
Curated OER
Confusing Colors!
Fourth graders collect data, graph their data, and then make predictions based upon their findings. They's interest is maintained by the interesting way the data is collected. The data collection experiment is from the psychology work of...
Curated OER
Statistical Accuracy and Reliability
Ninth graders assess the accuracy and reliability of current survey data and how it is represented. They design a survey, collect data, and use technology to analyze the data and present the results. Students examine scatter plots and...
Curated OER
M&M Exponential Activity
Students create a scatter plot of their experimental data. In this algebra lesson, students use M&M's to determine an algebraic model. They discuss results in class.
Curated OER
Lesson Plan On Fran Data
Seventh graders investigate the concept of functions and how they are used in the context of the real world while identifying the dependent and independent variables. They graph relations and functions and find the zeros of functions....
Curated OER
The Bigger they Are . . .
Students do a variety of data analyses of real-life basketball statistics from the NBA. They chart and graph rebounding, scoring, shot blocking and steals data which are gathered from the newspaper sports section.
Curated OER
Walking the Plank
Eighth graders experiment with a bathroom scale, books and a plank to determine how weight readings change as distance is applied. They graph and interpret the results.
Curated OER
A Functional Housing Market
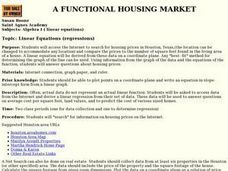
Students access the Internet to search for housing prices in Houston, Texas,(the location can be changed to accommodate any location) and compare the prices to the number of square feet found in the living area of a house.
Curated OER
Plot! Analyze! Draw your Conclusions!
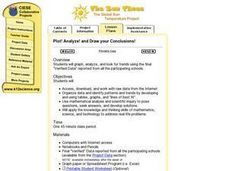
Students download data reported from the Global Sun Temperature Project website. They graph and analyze the data looking for trends and patterns. They prepare a class report with their observations and post it to the website.
Curated OER
Mathematical Techniques - Basic Graphing
Students are introduced to significant figures and how to add, subtract, multiply and divide them. In a group, they practice plotting data points from a table to a graph and labeling all axes. They calculate the slope and y-intercept and...
Curated OER
You Gotta Have Heart
Ninth graders investigate the concept of relations and interpret graphs and tables. They analyze given data and look for a pattern to determine if the numbers represent a function. Students practice solving scientific word problems that...
Curated OER
Building Paper Bridges
Students construct a bridge that can hold 100 pennies. In this math lesson, students evaluate the strength of their bridges. They predict how much weight a bridge can hold based on its design.
Curated OER
Picasso's "The Butterfly"
Students draw a butterfly. In this drawing lesson, students explore a drawing upside down. Students sketch a butterfly while the image is reversed to tap into their right brain dominance.
Curated OER
Moment of Inertia Contest
Learners design a wheel that can go down the ramp with the smallest moment of inertia. In this technology lesson, students construct their model using a computer program. They calculate the moment of inertia of their finished product.
Curated OER
What Can I Do For You?
Young scholars explore philanthropic acts within the school. In this philanthropy lesson, students list acts of philanthropy they can do at school and sing songs about philanthropic acts.
Curated OER
Picasso's "The Dog"
Learners draw a dog. In this drawing lesson, students discover how to tap into their right brain dominance by sketching a picture upside down. Learners draw a picture resembling Picasso's "The Dog".
Curated OER
Story Problem Writing
Pupils write story problems which can only be solved with the application of multiplication facts. They write an extra fact that isn't needed to solve. When their partners do the problems, they must cross out the fact that they do need.
Curated OER
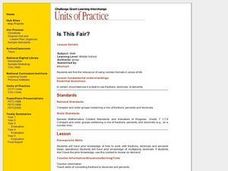
Is This Fair?
Middle schoolers discover how to convert fractions to decimals and percents. They play the role of a shopper to complete this activity.
Curated OER
Using Chuang Tzu in a British Literature Curriculum
Students read and compare/contrast translations of Chuang Tzu and "Beowulf." They complete handouts, answer discussion questions, identify themes and symbols, and complete various writing assignments.
Curated OER
Variation
In this variation worksheet, students interpret and organize data. They find the distance between points. Students use ratios to determine volume This six-page worksheet contains approximately 20 problems. Answers...
Curated OER
Perimeter and Area
Fifth graders identify the area and perimeter of a rectangle. In this perimeter lesson, 5th graders use geoboards and rubber bands to construct various rectangles. Students use the formula to calculate area and perimeter of the...
Curated OER
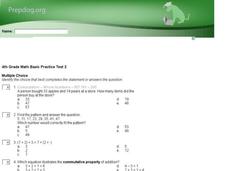
Online Interactive Math: Upper Elementary: Mixed Skills
In this online math worksheet, students complete a 20 problem multiple choice online interactive worksheet with mixed skills including geometry, rounding, and three digit multiplication.
Curated OER
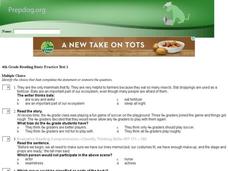
Evaluative Reading Comprehension
In this reading worksheet, students answer multiple choice questions about reading lists, classifying, grouping sentences, and more. Students complete 20 problems.
Other popular searches
- Line of Best Fit
- Lines of Best Fit
- Math Best Fit Line
- Best Fit Linear Data
- Algebra Line of Best Fit
- Best Fit Line Worksheets
- Best Fit Linear Data"
- Correlation Best Fit Lines
- Graphing Best Fit Linear Data


