Texas Education Agency
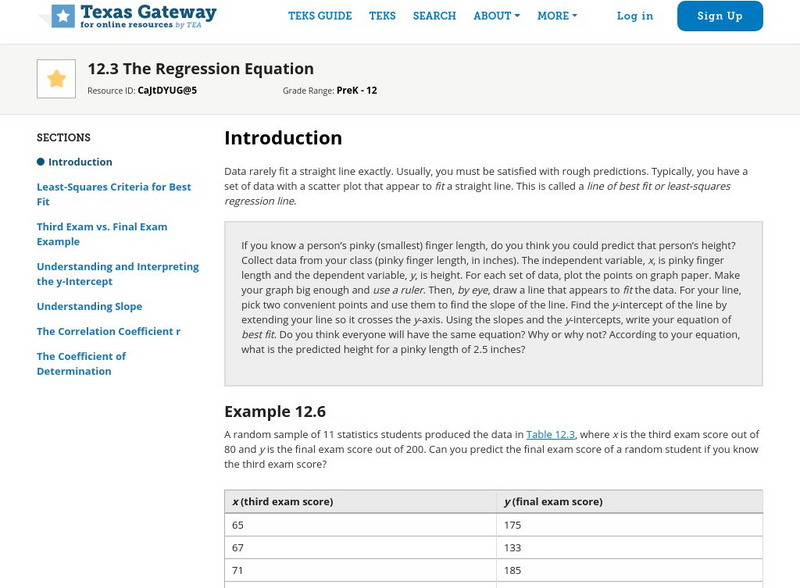
Texas Gateway: Tea Statistics: The Regression Equation
A tutorial on how to find the line of best fit or least-squares regression line for a set of data in a scatter plot using different methods and calculations.
Other
Nearpod: Scatterplots, Correlation & Lines of Best Fit
In this instructional activity on scatterplots, students will learn how to create the line of best fit and analyze scatterplots by learning about correlations and causation.
Houghton Mifflin Harcourt
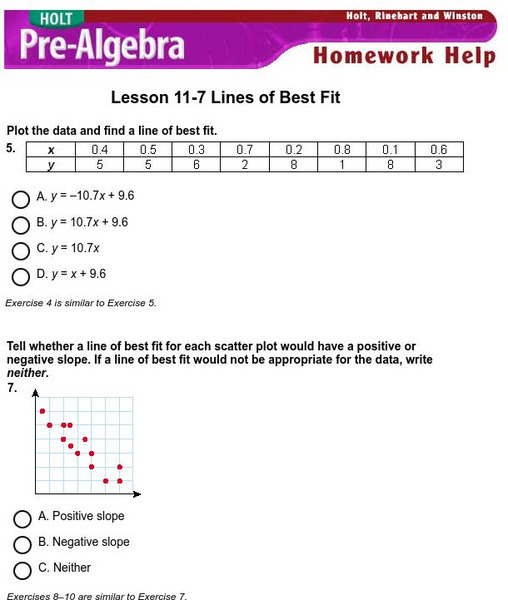
Holt, Rinehart and Winston: Homework Help Independent Practice: Lines of Best Fit
Get independent practice working with lines of best fit. Each incorrect response gets a text box explanation and another try. Correct responses are confirmed.
University of Illinois
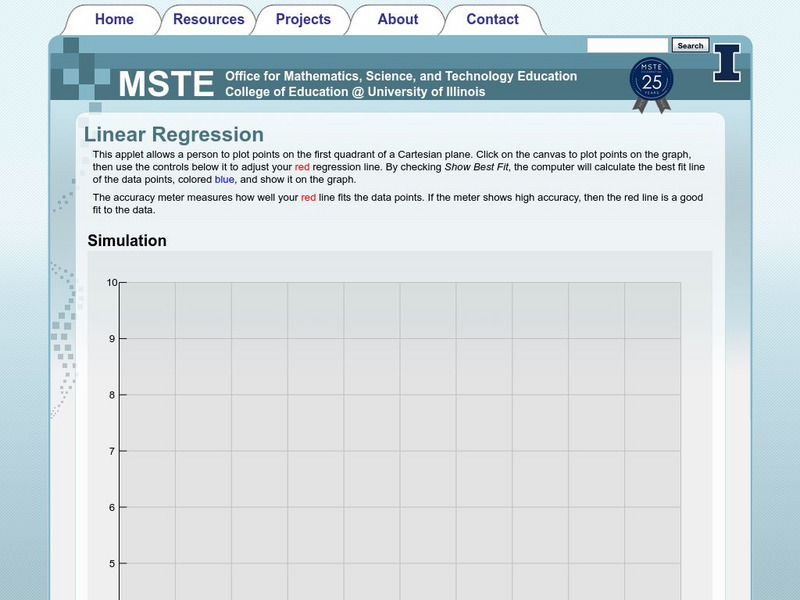
University of Illinois: Linear Regression Applet
This applet allows you to plot up to fifty points and it will display a best fit line and give you the slope of that line.
Texas Instruments
Texas Instruments: Getting Started With the Ti Navigator: If the Line Fits
This lesson introduces students to Activity Center and introduces students to the use of symbolic algebra to represent real world situations. They will use Activity Center to contribute equations that model a linear relationship and then...
Texas Instruments
Texas Instruments: Line of Best Fit
In this activity, students learn to collect data and plot the data. They use the manual-fit feature to form a line of best fit.
Texas Instruments
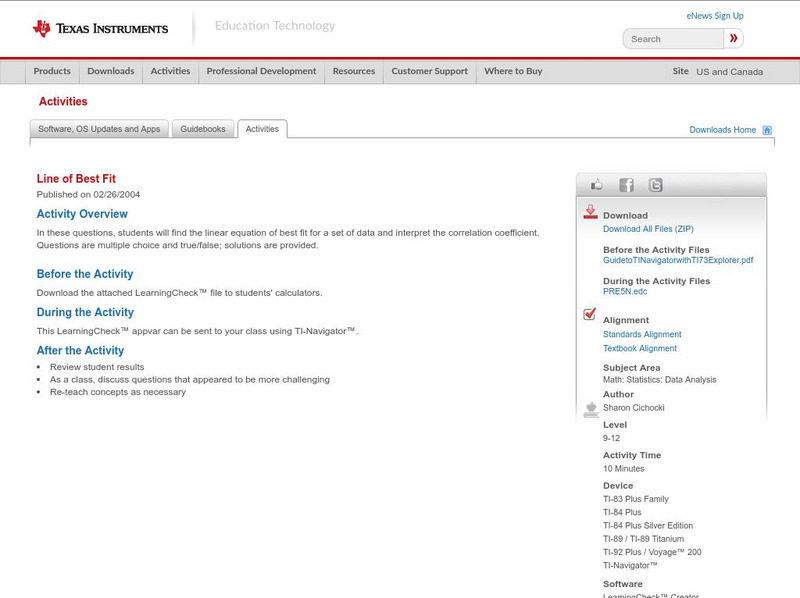
Texas Instruments: Line of Best Fit
In these questions, students will find the linear equation of best fit for a set of data and interpret the correlation coefficient. Questions are multiple-choice and true/false; solutions are provided.
Texas Instruments
Texas Instruments: Numb3 Rs: How Much Can They Win?
Based off of the hit television show NUMB3RS, this lesson has students create data points from given information, plot those points, and then create a line of best fit. This is done in the context of playing blackjack, although the...
Texas Instruments
Texas Instruments: Trying to Find a 'Best' Fit a Heuristic Approach
In this Derive activity, students determine the optimal location for a warehouse so that it is close to the center of a circle that passes through all the outlets of a store in the region.
CK-12 Foundation
Ck 12: Statistics: Scatter Plots on the Graphing Calculator
[Free Registration/Login may be required to access all resource tools.] This lesson covers finding the equation of best fit using a graphing calculator.
Texas Instruments
Texas Instruments: Run Me a Linear Regression
This activity is designed to give students the opportunity to estimate the least squares line given a set of points. The students are then able to check their "best fit" line by running a linear regression using the graphing calculator.
Sophia Learning
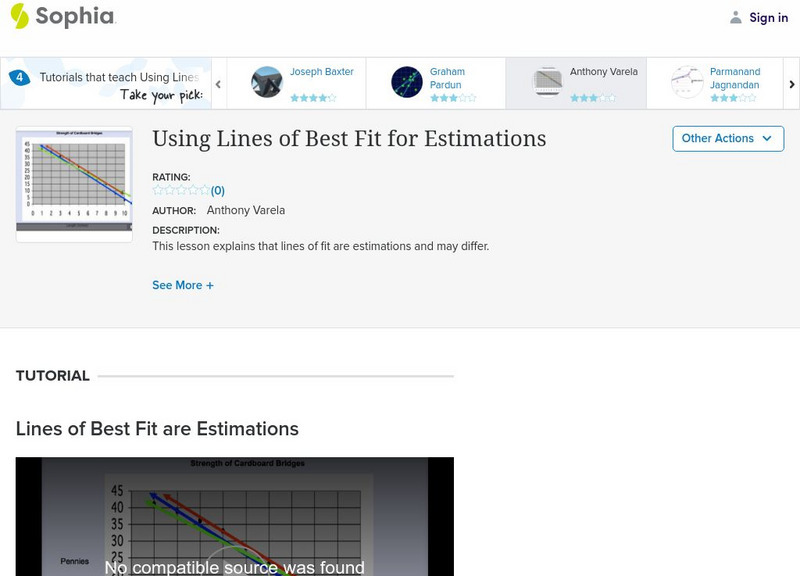
Sophia: Using Lines of Best Fit for Estimations: Lesson 3
This lesson explains that lines of fit are estimations and may differ. It is 3 of 3 in the series titled "Using Lines of Best Fit for Estimations."
Texas Instruments
Texas Instruments: Learning to Do Linear Regressions
This activity compares children's age to height to teach linear regressions. The handout includes notes for students and teachers with a step-by-step lesson on how to do three types of linear regressions - Best Fit line, Median Line and...
TeachEngineering
Teach Engineering: Walk the Line: A Module on Linear Functions
This module leads students through the process of graphing data and finding a line of best fit while exploring the characteristics of linear equations in algebraic and graphic formats. Then, these topics are connected to real-world...
Texas Instruments
Texas Instruments: An Olympic Plot
In this activity, students find lines of best fit to model Olympic data.
Math Graphs
Houghton Mifflin: Math Graphs: Line of Best Fit 9 [Pdf]
The practice problem has learners sketch a line of best fit, create a linear model, and compare both lines on a calculator. The given points are available in PDF format.
Math Graphs
Houghton Mifflin: Math Graphs: Line of Best Fit 10 [Pdf]
The practice problem has learners sketch a line of best fit, create a linear model, and compare both lines on a calculator. The given points are available in PDF format.
Math Graphs
Houghton Mifflin: Math Graphs: Line of Best Fit 11 [Pdf]
Students sketch a line of best fit, create a linear model, and compare both lines on a calculator. The given points are available in PDF format.
Math Graphs
Houghton Mifflin: Math Graphs: Line of Best Fit 12 [Pdf]
Students sketch a line of best fit, create a linear model, and compare both lines on a calculator. The given points are available in PDF format.
Math Graphs
Houghton Mifflin: Math Graphs: Line of Best Fit 1 [Pdf]
The practice problem examines the line of best fit and scatter plots. The scatter plot is available in PDF format.
Math Graphs
Houghton Mifflin: Math Graphs: Line of Best Fit 2 [Pdf]
The practice problem examines the line of best fit and scatter plots. The scatter plot is available in PDF format.
Math Graphs
Houghton Mifflin: Math Graphs: Line of Best Fit 5 [Pdf]
Learners use a scatter plot to determine the line of best fit. The scatter plot is available in PDF format.
Math Graphs
Houghton Mifflin: Math Graphs: Line of Best Fit 6 [Pdf]
Learners use a scatter plot to determine the line of best fit. The scatter plot is available in PDF format.
Math Graphs
Houghton Mifflin: Math Graphs: Line of Best Fit 7 [Pdf]
The practice problem examines the line of best fit and a scatter plot. The scatter plot is available in PDF format.
Other popular searches
- Line of Best Fit
- Lines of Best Fit
- Math Best Fit Line
- Best Fit Linear Data
- Algebra Line of Best Fit
- Best Fit Line Worksheets
- Best Fit Linear Data"
- Correlation Best Fit Lines
- Graphing Best Fit Linear Data


