PBL Pathways
Doctors and Nurses
How many nurses does it take to support one doctor? A project-based activity asks learners to analyze state data to answer this question. Classes create polynomial functions from the data of doctors and nurses over a seven-year...
Teach Engineering
Exploring Variables While Testing and Improving Mint-Mobiles (for High School)
Mint candies are good for more than just one's breath. Using basic materials such as mint candies, straws, index cards, and Popsicle sticks, scholars create race cars that meet a given budget as well as design constraints. They perform...
PBL Pathways
Do Homework?
To complete homework or not to complete homework ... that is the question. Decide whether it makes a difference on finals by doing homework. Individuals create a scatter plot and find a line of best fit for data on the percent of...
EngageNY
More Division Stories
Don't part with a resource on partitive division. Continuing along the lines of the previous lesson, pupils create stories for division problems, this time for partitive division problems. Trying out different situations and units allows...
Curated OER
Bungee Jump Lab
Student apply linear relationships to the real world. They use Ken and Barbie dolls and experiment to find the line of best fit. They collect data, analyze data, and make predictions from it. The students also use Microsoft Power Point...
Curated OER
Obstacles to Success: Misleading Data
Eleventh graders explore how data reported by country agencies can mislead the public intentionally or unintentionally. In this Cross Curricular activity, 11th graders analyze charts and graphs in order to draw conclusions. Students...
Curated OER
Salad Tray 3D Topographic Model
Students explore the characteristics of topographical maps. They examine the relationship of contour lines and vertical elevation. Students create a three-dimensional model of a landscape represented by a topographic contour map.
Teach Engineering
The Challenge Question
A research position becomes a modeling job. The introductory lesson plan in a series of nine presents the challenge of analyzing a set of bivariate data. The class brainstorms what the data may represent. Pupils must decide what is...
Curated OER
Academic Grade 9 Assessment of Mathematics: Algebra I and Geometry
Test your class, or use this 12 page math packet as chapter review. They solve 21 multiple choice problems which require them to graph linear equations, find the volume of prisms and cones, find unknown angles, and determine...
Inside Mathematics
Scatter Diagram
It is positive that how one performs on the first test relates to their performance on the second test. The three-question assessment has class members read and analyze a scatter plot of test scores. They must determine whether...
Kenan Fellows
Lego Thinking and Building
Run a simulated airplane manufacturing plant with your pupils as the builders! Learners build Lego airplane models and collect data on the rate of production, comparing the number produced to the number defective. Using linear...
Rochester Institute of Technology
Skateboard Performance Testing
Perform an activity on performance testing with a lesson focused on the purpose of wheel bearings on skateboards. Learners conduct performance testing on a skateboard to collect and interpret data.
101 Questions
Deodorant
Smells like learning! Young scholars collect data on the length of time a stick of deodorant lasts. After modeling the data with a graph and function, they make predictions about deodorant use over time.
Curated OER
Add up to 20
For this adding up to 20 worksheet, students try to match each line of the rectangle to add up to 20 using any whole numbers they choose. Students have 6 blanks to fill in and 2 questions at the end.
Curated OER
Statistics
In this statistics worksheet, students solve 2 problems that involving plotting data, recognizing ordered pairs, and analyzing the graphed relationship.
Curated OER
Statistics
In this statistics learning exercise, students view 6 graphs to determine the correlation. Students then answer 4 questions that involve plotting data, determining a relationship, and making predictions.
Curated OER
Modeling Population Growth
Young scholars collect data on population growth. In this statistics instructional activity, students graph their data and make predictions. They find the linear regression and the best fit line.
Curated OER
Celsius to Fahrenheit
Students convert degrees between two different units. In this algebra lesson plan, students graph linear equations and identify the line of best fit. They use their line of best fit to make predictions given a set of data.
Curated OER
Traveling Through the Solar System
Students use calculator and non-calculator methods for analyzing data. They apply data collection and analysis in a study of mass and weight. Students enhance and apply the concept of line of best fit. They master graphing in a plane,...
Center of Excellence for Science and Mathematics Education
A Sick Astronaut
Aspiring astronauts graph, interpret, and analyze data. They investigate the relationship between two variables in a problem situation. Using both graphic and symbolic representations they will grasp the concept of line of best fit to...
Curated OER
Spaghetti Graphs
Students work in pairs to test the strength of spaghetti strands. They collect and graph data to determine a line of best fit. Students create a linear equation to interpret their data. Based on the data collected, students predict...
Curated OER
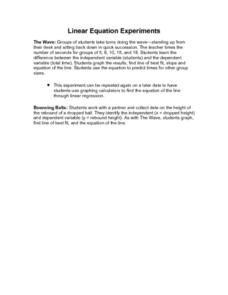
Linear Equation Experiments
In this linear equation instructional activity, students solve and complete 2 different experiments that include using linear equations. First, they determine the difference between independent and dependent variables. Then, students...
Curated OER
Exploring Linear Equations And Scatter Plots - Chapter 5 Review
Young scholars complete rolling stocks experiment, and collect and enter data on the computer. They enter data on graphing calculators, complete scatter plot by hand with line of best fit, and discuss different graphing methods.
Curated OER
Homonyms Worksheet 1
In this grammar worksheet, students underline the appropriate word in parentheses that best fits twenty-one sentences. Students check to make sure each sentence is grammatically correct.
Other popular searches
- Line of Best Fit
- Lines of Best Fit
- Math Best Fit Line
- Best Fit Linear Data
- Algebra Line of Best Fit
- Best Fit Line Worksheets
- Best Fit Linear Data"
- Correlation Best Fit Lines
- Graphing Best Fit Linear Data


