Radford University
Statistical Study
Put your knowledge of sample surveys to good use. Pupils begin by conducting a survey of class members. They identify an appropriate topic and sampling technique; collect and organize their data; compute and analyze statistical measures;...
Radford University
Understanding Local Economic Issues Using Statistics
A good understanding of local economics requires a lot of data. Scholars design and conduct an experimental survey to collect information about economic issues affecting their regions. They analyze their findings and prepare a...
Learning for Justice
Showing Empathy
A short social-emotional learning lesson teaches high schoolers how to show empathy toward others. After completing a short survey that has them assess their understanding of empathy, the class learns specific behaviors they can model to...
Learning for Justice
Cliques in Schools
Band geeks, jocks, preppies; every school has its groups. Middle and high schoolers identify the various friendship groups and cliques in their school and consider these groups' positive and negative traits. After completing a Clique...
Anti-Defamation League
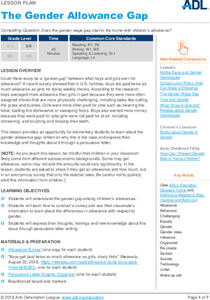
The Gender Allowance Gap
Does the pay gap begin with allowance? That is the big question scholars answer in a activity examining how gender affects how much money an individual earns. Class members conduct a survey to identify how the allowance is paid, take...
Rockefeller Archive Center
Understanding Mass Media News
In an age of fake news and photoshopped images, it is vital that 21st century learners development the skills they need to evaluate mass media and assess its validity. A great way to launch such a study is with a carefully crafted lesson...
Curated OER
Bias in Statistics
Learners work to develop surveys and collect data. They display the data using circle graphs, histograms, box and whisker plots, and scatter plots. Students use multimedia tools to develop a visual presentation to display their data.
Curated OER
Inventors Unit Survey
Students develop and conduct a survey for their inventors unit. They create a five question survey and tally the survey results, and create a graph using Microsoft Word and Graph Club 2.0.
Curated OER
Determination of Overall Water Quality Using a Quantitative Macroinvertebrate Survey
Young scholars examine water samples from a local stream. They identify various types of macroinvertebrates found in that water ecosystem and perform a quantitative macroinvertebrate survey to determine the stream's water quality.
Curated OER
Data Handling
In this data handling worksheet, students determine biased and unbiased questions to surveys. They explore methods of data collection and design a data collection sheet. This two-page worksheet contains 3 multi-step problems.
Curated OER
Data collection and analysis
In this probability and statistics worksheet, students determine when a survey or collected data could be biased. The one page worksheet contains a combination of three multiple choice and free response questions. Answers are included.
Curated OER
And the Survey Says...
Eighth graders evaluate whether a certain argument is valid or invalid. In this science lesson, 8th graders discuss the importance of using unbiased evidence. They design an experiment that they can test in school.
Google
Advanced 5: Evaluating Credibility of Sources
How do discerning readers determine bias and credibility? Ask small groups to figure it out! First, each group is provided with either articles or videos that contain bias. They examine the resources, respond to included questions, and...
Curated OER
The Power of Graphical Display: How to Use Graphs to Justify a Position, Prove a Point, or Mislead the Viewer
Analyze different types of graphs with learners. They conduct a survey and determine the mean, median and mode. They then identify different techniques for collecting data.
Fort Bend Independent School District
Data Analysis - AP Statistics
What better way to study survey design than to design your own survey! Bring a versatile data analysis project to your AP Statistics class, and encourage them to apply the practices from their instructions to a real-world survey project.
Radford University
A Change in the Weather
Explore the power of mathematics through this two-week statistics unit. Pupils learn about several climate-related issues and complete surveys that communicate their perceptions. They graph both univariate and bivariate data and use...
Curated OER
Our Favorites
Students participate in and conduct a survey to determine various class favorites. They collect, organize and display their data, interpret the results, and complete a packet of worksheets to display the information.
Curated OER
Conducting A Survey
Students identify the types of information gathering styles and different surveying styles. They distribute a survey around your school to determine the different forms of transportation used to get to school.
Curated OER
Discrimination on the Menu
Students study discrimination in the workplace. In this discrimination instructional activity, students define the term 'fair' and work in groups to find ways all people are alike and different. Students write sentences defining a fair...
Curated OER
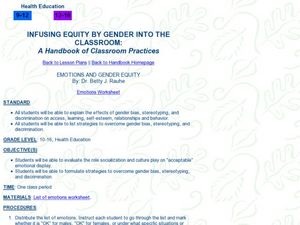
Infusing Equity by Gender Into the Classroom: A Handbook of Classroom Practices
Students match their natural proclivities to possible future careers which are nontraditional for their genders. They further examine gender stereotypes through other activities.
Curated OER
INVESTIGATING NONTRADITIONAL OCCUPATIONS
High schoolers identify careers that are nontraditional for their gender. In this occupations lesson students research careers that are nontraditional for their gender and conduct interviews with individuals employed in nontraditional...
Virginia Department of Education
Organizing Topic: Data Analysis
Learners engage in six activities to lead them through the process of conducting a thorough analysis of data. Pupils work with calculating standard deviations and z-scores, finding the area under a normal curve, and sampling techniques....
Los Angeles County Office of Education
Assessment For The California Mathematics Standards Grade 6
Test your scholars' knowledge of a multitude of concepts with an assessment aligned to the California math standards. Using the exam, class members show what they know about the four operations, positive and negative numbers, statistics...


