Radford University
Marketing Mayhem: Advertising for Adolescents
You'll be sold on using the resource. Future consumers first conduct a sample survey on marketing strategies. They then consider how mass media influences their age groups and create presentations to display their findings.
Curated OER
Who's got the fastest legs?
Students use a stopwatch to collect information for a scatterplot. For this fastest legs lessons, students collect data through the taking of measurements, create and find a median number. Students develop an equation and...
Scholasic
The Magic School Bus and the Missing Tooth
We chew with our teeth every day, but how much do we really know about them? Allow Ms. Frizzle to teach your kids a thing or two about teeth. Kids complete a prereading exercise, read the book, and respond to several prompts about the...
Balanced Assessment
Cost of Living
Math scholars investigate the cost of living in Hong Kong compared to Chicago but must first convert the different types of currency. They then choose a type of graph to compare different spending categories and finish the activity by...
College Board
2017 AP® Statistics Free-Response Questions
Reduce testing anxiety by helping learners prepare for test day. Scholars complete six free-response questions from a released AP® exam. The questions test a variety of concepts including confidence intervals, frequency tables,...
PBS
The Power of Personal Narrative
Personal narratives are powerful things. Whether told from the first-person or third-person point of view, whether in the form of an essay, a short story, novel, or video, whether fiction or fact, they capture readers and give them...
Simon & Schuster
Classroom Activities for The Call of the Wild by Jack London
Three activities are designed for readers of Jack London's The Call of the Wild. First, class members research and create posters that reflect the setting of the novel. Next, groups create posters with images that represent each chapter...
Penguin Books
A Teacher's Guide to the Signet Classic Edition of Charles Dickens's A Tale of Two Cities
It's not the best of guides nor the worst of guides, but time spent examining the guide to Charles Dickens's A Tale of Two Cities is certainly not wasted. The 17-page guide includes book-by-book synopses of the novel, before,...
Curated OER
Ballad
Young balladeers analyze examples of ballads and generate a list of common traits (story, quatrains, rhyme schemes, refrains, etc.), then identify these traits in Robert W. Service's "The Cremation of Sam McGee" and a ballad written by...
Curated OER
Inequalities and Measures of Central Tendency
In this inequality and measures of central tendency worksheet, students solve and graph linear inequalities. They organize given data to identify the mean, mode and range. Students interpret box-and-whisker plots. This three-page...
Curated OER
Univariate Data Analysis
Students use given data to compare baseball players. They create box and whisker plots to compare the players and determine which they feel is the best player. Students use calculators to make box and whisker plots. They write paragraphs...
Georgia Department of Education
The Basketball Star
Have learners use math to prove they are sports stars! Assess a pupil's ability to create and analyze data using a variety of graphs. The class will be motivated by the association of math and basketball data.
Curated OER
Cumulative Frequency
In these word frequency worksheets, students choose a page from a newspaper and count the number of letters in each word and complete their results in a table. Students then calculate the mean number of letters. Students then collect...
Curated OER
Bias in Statistics
Students work to develop surveys and collect data. They display the data using circle graphs, histograms, box and whisker plots, and scatter plots. Students use multimedia tools to develop a visual presentation to display their data.
Curated OER
Graphs Review
Seventh graders review different types of graphs such as bar graphs, line graphs, box & whisker plots. As a class, they read a story and construct graphs to solve the data in the story. Students play "Graph Jeopardy" which requires...
Curated OER
Different Perspectives of Oregon's Forest Economic Geography
Young scholars map data on employment in wood products manufacturing in Oregon counties. In this Oregon forest lesson plan, students discover the percentage of people employed in the forest manufacturing industry. Young scholars create a...
Curated OER
Using a Statistical Procedure To Search A Database For Out of the Ordinary Values
Students develop a spreadsheet containing formulas and find summaries for them. In this investigative lesson students choose a topic, investigate it and use MS Excel to sort data.
American Museum of Natural History
Trip Up Your Brain
Sometimes different parts of the brain disagree. See what this disagreement looks like using a remote learning resource to experience how brains often take shortcuts. Pupils complete the activity, observe their results, and then read...
Curated OER
The Dog Days of Data
Students are introduced to the organization of data This lesson is designed using stem and leaf plots. After gather data, they create a visual representation of their data through the use of a stem and leaf plot. Students
drawing...
Curated OER
Fruit Loops/Cheerios Activity: Measures of Central Tendency
In this measures of central tendency worksheet, students use Fruit Loops and Cheerios to gather statistical data. They find the mean, mode and median of the data. Students construct a box-and-whisker plot of the class data. This...
Curated OER
Midterm 1 Exam: Statistics
For this statistics worksheet, students determine the mean, variance, standard deviation and median of given statistical data. They organize data, create box-and-whisker plots and identify outliers. This nine-page worksheet contains 7...
Curated OER
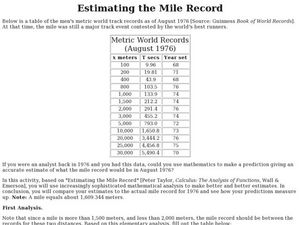
Estimating the Mile Record
In this estimating the mile record, students examine given data. They use create a box-and-whisker plot to determine the upper and lower quartiles of the data. This one-page worksheet contains 1 multi-step problems.
Curated OER
Data Analysis and Data Explorer
Students use the Data Explorer software to organize and display the test scores for the classes in stacked box-and-whisker plots, then analyze the results in paragraph form.
Curated OER
Histograms
Young statisticians explore the concept of histograms. They construct histograms of various data such as change in a student's pocket, and guessing on a test. hHey analyze data represented as a histogram and a box plot and compare...


