Statistics Education Web
Saga of Survival (Using Data about Donner Party to Illustrate Descriptive Statistics)
What did gender have to do with the survival rates of the Donner Party? Using comparative box plots, classes compare the ages of the survivors and nonsurvivors. Using the same method, individuals make conclusions about the gender and...
Statistics Education Web
Consuming Cola
Caffeine affects your heart rate — or does it? Learners study experimental design while conducting their own experiment. They collect heart rate data after drinking a caffeinated beverage, create a box plot, and draw conclusions. They...
Mathematics Vision Project
Module 9: Modeling Data
How many different ways can you model data? Scholars learn several in the final module in a series of nine. Learners model data with dot plots, box plots, histograms, and scatter plots. They also analyze the data based on the data...
Curated OER
Box and Whiskers
Middle schoolers discover how to relate collected data with a box and whiskers graph in a number of formats. They collect, organize, create, and interpret a box and whiskers graph. Pupils interpret the difference between sets of data,...
Curated OER
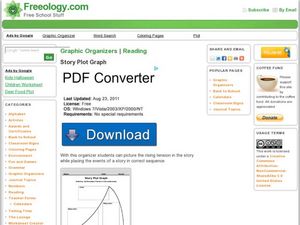
Story Plot Graph
This graphic organizer allows readers to visualize the introduction, rising action, climax, falling action, and denouement of a story by filling in five corresponding boxes with details from a story.
CCSS Math Activities
Smarter Balanced Sample Items: 7th Grade Math – Target H
Not one but two box plots. How will your pupils fare? Assess their understanding of box plots by having them compare two populations. The eighth of nine installments in the Gr. 7 Claim 1 Item Slide Shows series, the resource has them...
CK-12 Foundation
Create and Understand Box-and-Whisker Plots: Babies in a Waiting Room
Explore the strengths and weaknesses of box-and-whisker data display. An interactive lesson asks learners to create a box-and-whisker plot from a set of data. Challenge questions focus on determining what types of conclusions they can...
CCSS Math Activities
Smarter Balanced Sample Items: 6th Grade Math – Target J
What is the best measure of central tendency? Scholars explore mean, median, mode, range, and interquartile range to understand the similarities and differences. They display data in dot plots, histograms, box plots, and more as part of...
Flipped Math
Unit 4 Review: One Variable Statistics
It's always nice to slow down and review. Scholars work on problems covering concepts on one-variable statistics. They create and interpret box plots and stem-and-leaf plots, determine the mean, median, mode, interquartile range, and...
Utah Education Network (UEN)
Statistics
Find the value in analyzing data values. Statistics is the focus in the fifth of seven installments of the 6th Grade Math series. Individuals learn to examine dot plots, histograms, and box plots by considering the shape, mean, median,...
College Board
2008 AP® Statistics Free-Response Questions
Is your knowledge of statistics at an AP® level? Scholars try out the 2008 AP® Statistics free-response questions. The questions cover box plots, scatter plots, distributions, probability distributions, experiments, statistical tests,...
College Board
2009 AP® Statistics Free-Response Questions Form B
Is your class taking the AP® Statistics exam in the near future? You may want to take a look here. Using the 2009 AP® Statistics free-response questions Form B helps learners become familiar with the testing conditions, such as time...
College Board
2010 AP® Statistics Free-Response Questions Form B
Form a good familiarity with the AP® test using Form B of the 2010 AP® Statistics free-response questions. Pupils use a test from a previous administration to prepare for their exams. A set of six questions assesses box plots,...
Curated OER
Plotting Data Tables
Young scholars make a table and plot their data on a graph. In this algebra activity, students graph piecewise functions using the given equations along with the restricted domain. They calculate the rate of change.
Curated OER
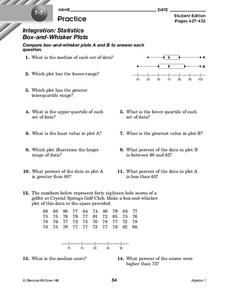
Box-and-Whisker Plots
For this box-and-whisker plots worksheet, 9th graders solve and complete 14 different problems that include comparing various box-and-whisker plots. First, they determine the median for each set of data and plot the lesser range. Then,...
Curated OER
Exploring Linear Equations And Scatter Plots - Chapter 5 Review
Students complete rolling stocks experiment, and collect and enter data on the computer. They enter data on graphing calculators, complete scatter plot by hand with line of best fit, and discuss different graphing methods.
Curated OER
Plot Development and Conflict
Students explore plot development and how conflicts are resolved. In this plot development and conflict lesson, students discuss antonyms and list the ones they find in their story. Students complete online activities and write a summary...
Curated OER
Box Plots
Students review the concept of median, explore how to calculate quartiles for any size data set and experience how to build a box plot.
EngageNY
Describing Center, Variability, and Shape of a Data Distribution from a Graphical Representation
What is the typical length of a yellow perch? Pupils analyze a histogram of lengths for a sample of yellow perch from the Great Lakes. They determine which measures of center and variability are best to use based upon the shape of the...
Greater Grace Christian Academy
Cereal Box Book Report
Need a creative idea for an elementary book report? Use a cereal box project to engage your readers beyond plot, setting, and characters. The lesson includes templates for the project and examples from Charlie and the Chocolate...
Scholastic
A Reading Guide to A Wrinkle in Time
Accompany a reading of Madeleine L'Engle's classic tale, A Wrinkle in Time, with a detailed guide equipped with 15 informative and useful chapters. Scholars discover who the author is, why she wrote the book, and crucial story elements...
PBS
Button, Button
Youngsters count, classify, and estimate quantities using buttons after a read aloud of The Button Box by Margarette S. Reid. They discuss the difference between guessing and estimating. Based on an experiment, they predict the number of...
Curated OER
Leveled Problem Solving: Range and Outliers
In this range and outliers activity, students solve 6 word problems where they examine data then identify outliers, find the upper and lower quartile ranges, find the interquartile range and create box-and-whisker plots.
Curated OER
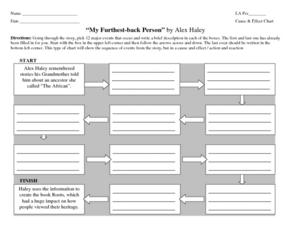
Cause & Effect Chart: "My Furthest-Back Person" by Alex Haley
Help your class see the connection between events in Alex Haley's story "My Furthest-Back Person" with this awesome graphic organizer. Individuals write a brief description of 10 major plot events in a series of boxes. The first and last...
Other popular searches
- Analyzing Box Plots
- Outliers Box Plots
- Interpret Box Plots
- Graphs Box Plots
- Analysing Box Plots
- Leaf Box Plots
- Statistics Box Plots
- Conclude Box Plots
- Box Plots Worksheets
- Double Box and Whisker Plots
- Scatterplot Box


