Curated OER
Building With Triangles
Students participate in a unit on triangles. Through the unit they explore different way to make basic shapes using triangles. They also examine the basic properties of triangles and the relationships among basic geometrical shapes in...
Curated OER
Rocket Construction
Students create rockets out of wood. They practice using comparison words to describe the differences in height. They also color pictures of rockets from different countries.
Curated OER
Lines and Angles with K'NEX
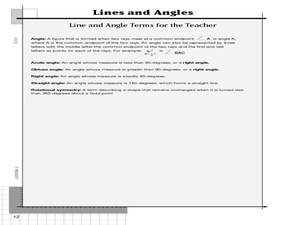
Here is a geometry lessonwhich invites learners to create models using their knowledge of lines, segments, rays, and angles. This lesson reinforces geometric vocabulary and concepts through practical application, it also includes...
EngageNY
Calculating Probabilities of Events Using Two-Way Tables
Tables are useful for more than just eating. Learners use tables to organize data and calculate probabilities and conditional probabilities.
California Education Partners
Improving Our Schools
Split the work three ways. Learners use their knowledge of fractions to solve problems dealing with splitting up work loads evenly between three groups. Scholars determine the fractional portion of work each group will do along with...
Curated OER
Stack It Up!
Students analyze and begin to design a pyramid. Working in engineering teams, they perform calculations to determine the area of the pyramid base, stone block volumes, and the number of blocks required for their pyramid base. They make a...
Inside Mathematics
Coffee
There are many ways to correlate coffee to life, but in this case a worksheet looks at the price of two different sizes of coffee. It requires interpreting a graph with two unknown variables, in this case the price, and solving for those...
EngageNY
Modeling with Inverse Trigonometric Functions 2
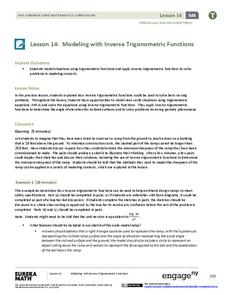
Use inverse trigonometric functions to work with ramps, rabbits, and Talladega. The class models real-world situations with trigonometric functions and solves them using inverses in the 15th installment of a 16-part series. Pupils solve...
California Education Partners
Science Fair Project
Plant the data firmly on the graph. Given information about the growth rate of plants, pupils determine the heights at specific times and graph the data. Using the information, scholars determine whether a statement is true and support...
Curated OER
The Luxor Hotel Contract
High schoolers determine the surface area of the Luxor Hotel, using the square feet of the base, volume, and the volume formula. They create a scale model of the triangular/pyramid shaped hotel.
Curated OER
Pythagoras' Theorem
Learners are introduced to the Pythagoras' Theorem and its history, proofs and practice in application. Students find perimeters, areas and volume of everyday objects. Learners state and explain the theory.
Curated OER
Reading Graphs
Working independently or in teams, your class practices connecting graphs, formulas and words. This lesson includes a guided discussion about distance vs. time graphs and looking at how velocity changes over time.
Mathematics Assessment Project
Representing Trigonometric Functions
Discover the classic example of periodicity: Ferris wheels. Young mathematicians learn about trigonometric functions through Ferris wheels. They match functions to their graphs and relate the functions to the context.
EngageNY
Volume of Composite Solids
Take finding volume of 3-D figures to the next level. In the 22nd lesson of the series, learners find the volume of composite solids. The lesson the asks them to deconstruct the composites into familiar figures and use volume formulas.
Rice University
Intermediate Algebra
Algebra concepts are all wrapped up in one nice bow. The resource combines all the concepts typically found in Algebra I and Algebra II courses in one eBook. The topics covered begin with solving linear equations and move to linear...
EngageNY
Analyzing Residuals (Part 1)
Just how far off is the least squares line? Using a graphing calculator, individuals or pairs create residual plots in order to determine how well a best fit line models data. Three examples walk through the calculator procedure of...
EngageNY
Relationships Between Two Numerical Variables
Is there another way to view whether the data is linear or not? Class members work alone and in pairs to create scatter plots in order to determine whether there is a linear pattern or not. The exit ticket provides a quick way to...
EngageNY
Exploiting the Connection to Trigonometry 1
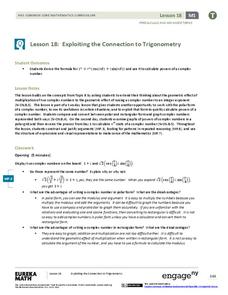
Class members use the powers of multiplication in the 19th installment of the 32-part unit has individuals to utilize what they know about the multiplication of complex numbers to calculate the integral powers of a complex number. Groups...
EngageNY
Exploiting the Connection to Trigonometry 2
The class checks to see if the formula for finding powers of a complex number works to find the roots too. Pupils review the previous day's work and graph on the polar grid. The discussion leads the class to think about how to reverse...
EngageNY
Probability Distribution of a Discrete Random Variable
Learn how to analyze probability distributions. The sixth installment of a 21-part module teaches pupils to use probability distributions to determine the long-run behavior of a discrete random variable. They create graphs of probability...
Curated OER
Fantasy Baseball
Check out this thematic unit, based on the game of baseball. Learners investigate numbers and number relations as they become familiar with some of the basic terminology associated with the game. They focus their attention on actual...
Improving Measurement and Geometry in Elementary Schools
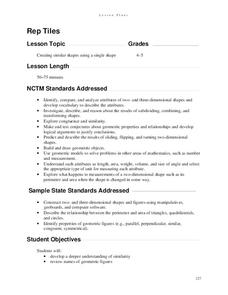
Rep Tiles
In addition to the catchy title, this lesson plan provides upper graders an opportunity to more closely scrutinize the attributes of plane figures. In particular, they focus on the similarity of different shapes. Both whole-class and...
Statistics Education Web
Walk the Line
How confident are you? Explore the meaning of a confidence interval using class collected data. Learners analyze data and follow the steps to determine a 95 percent confidence interval. They then interpret the meaning of the confidence...
Agile Mind
Transforming Graphs of Quadratic Functions
In the activity on this webpage, learners use interactive graphing technology to investigate transformations of graphs. In the first part of the task, they look at the graph of a quadratic function with coordinates of a few points...


