Curated OER
Yearbook Video
Young scholars brainstorm ideas for creating video yearbook, practice taking digital pictures and using Graphic Converter, complete interviews of students and staff members, and create movie using Avid Cinema.
Curated OER
Dissolved Oxygen and Respiration
Students are presented with the question, "Do plants that grow underwater use oxygen?" They create an experiment to test the presence of dissolved oxygen in the water using provided materials. Student experiments include a control jar as...
Curated OER
Tides in the Hudson
Students view an illustration of the Hudson River watershed and identify the bodies of water shown. They discuss what happens when fresh and salt water mix. Students view a teacher demonstration of the stratification of fresh and salt...
Curated OER
CSET Test
The California Subject Examination for Teachers or CSET is a must pass if you want to teach in California. Prepare young career-minded learners or paraprofessionals with an overview of the exam, five multiple choice questions, and a...
Curated OER
Change Since 1609
Students recognize how the climate of the Hudson Valley has changed since the last glaciation. They explain these changes using a reconstruction of the land use changes in the Hudson Valley composed of confetti, Ziploc bags and other...
Curated OER
Paleoclimate of the Hudson Valley
Students recognize how the climate of the Hudson Valley has changed since the last glaciation and be able to explain these changes. They reconstruct the paleoclimate of the Hudson Valley.
Curated OER
Dissolved Oxygen and Temperature
Students are shown how temperature affects dissolved oxygen and they create a graph showing this relationship. They think about the adaptations of animals to live in different water temperatures. Students test four different water...
Curated OER
Dissolved Oxygen Introduction
Students are shown how dissolved oxygen enters the water. They are taught the difference between a water sample that has been exposed to the air and one that has not. Students brainstorm what organisms need to survive. They use dissolved...
Curated OER
Is Our Water Healthy?
Students test water for a least one chemical characteristic. They hypothesize how a storm event might change the chemical characteristics of a stream. Students collect water samples and use the chemical test to test the water.
Curated OER
Aquatic Ecosystem Exploration
Students visit a local stream, pond, creek, or river and collect macroinvertebrates. They sort macroinvertebrates and identify each species using a dichotomous key. Students decide on trophic levels and construct a possible food web for...
Curated OER
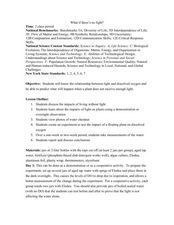
What If There's No Light?
learners discuss the importance of light and the consequences of living without it. Using a plant as a demonstration, students predict and observe what happens to a plant when it does not receive enough light. In groups, they experiment...
Curated OER
Runoff: Intro to Watersheds
Students are taught that a watershed is, what types of basic land cover are impermeable and permeable to water. They trace the flow of water around their school and around their home. Students determine what watershed their school is a...
Curated OER
Invasives and Marsh Birds
Students are taught that invasive plant removal can have a variety of impacts. They are shown this by using graphs. Students view maps of vegetation change on Iona Island. They discuss implications of changes on marsh birds using data...
Curated OER
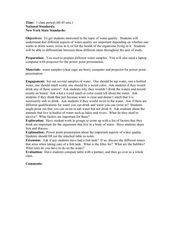
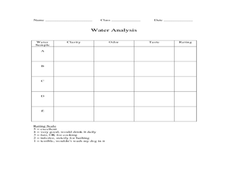
Water Quality with Samples
Students recognize whether one wants to drink water, swim in it, or for the health of the organisms living in it. They prepare different water samples to observe and collect samples regarding the water quality.
Curated OER
Bottled Water vs. Tap Water
Students analyze the similarities and differences between tap water and bottled water. They make informed decisions about their use of each. Students are asked if they drink mostly tap water straight from the tap or water fountain. They...
Curated OER
Hudson Valley Rocks
Students identify each of the rocks provided and locate where in the valley they are found. They explain why the rocks came to be as they are in each location. In addition, they relate the exercise to how the Hudson Valley's geologic...
Curated OER
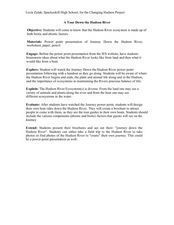
A Tour Down the Hudson River
Young scholars discuss how the Hudson River is an ecosystem made up of both biotic and abiotic factors. They view the PowerPoint the Journal Down the Hudson River. Students become aware of where the Hudson River begins and ends, the...
Curated OER
Zebra Mussel Population Simulation
Learners are taught how to format and enter data into an Excel spreadsheet. They make a graph, and interpret graphed data. Students discuss the possible impacts of zebra mussels on the Hudson river. They graph zebra mussel data.
Curated OER
Water Chestnut Graphing Activity
Students are taught how to format and enter data into an Excel spreadsheet. They make a graph and interpret graphed data. Students discuss possible impacts of water chestnut invasion. They graph data on water chestnut. Students report...
Curated OER
Wastewater
Students discuss what happens to their wastewater. They read about the wastewater treatment process. Students are asked what types of things get flushed down toilets or goes down drains in sinks and showers. They are taught what happens...
Curated OER
How Much Water is in That River?
Students practice measurement using the Hudson River. They calculate the discharge measurement at a location on the Hudson River using ingenuity and a topographic map.
Curated OER
Who Will Care for the Water?
Students discover how humans impact natural resources. In this environmental lesson, students identify water resources in the local area and construct a T-chart to compare the positive and negative effects humans have on water resources.
Curated OER
The Nature of Mathematics
In this nature of mathematics worksheet, students identify the different aspects of mathematics and how simple mathematical models are constructed to solve problems. Then, they define the power and limitations of mathematical analysis....
Curated OER
Teaching to Learn: A Reciprocal Teaching Lesson
You can have your students become the teachers to review and demonstrate content knowledge.


