Curated OER
You Can Count on Spelling
Here is a cross-curricular activity that is suitable for virtually any grade level! Learners calculate the mathematical value of their spelling words using the letter tiles from a Scrabble game and identify the spelling word with the...
Curated OER
Weighted Averages
Weighted averages can be tricky to explain! However, this study guide makes it easy for teachers by including definitions, explanations, and breaking down problems into three steps. Includes mixture problems and uniform motion problems.
Inside Mathematics
Graphs (2006)
When told to describe a line, do your pupils list its color, length, and which side is high or low? Use a worksheet that engages scholars to properly label line graphs. It then requests two applied reasoning answers.
Teach Engineering
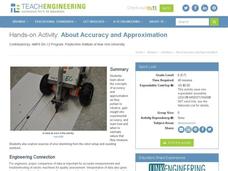
About Accuracy and Approximation
How accurate are robots? Groups draw lines by moving robots backwards and forwards by one rotation of the wheels. Using the appropriate formula, they determine the percent error in the length of the lines in relation to the calculated...
Curated OER
Acceleration Lab
Young Einsteins experiment with the acceleration of Hot Wheels™ toy cars down inclined planes at various angles. This classic physics lab activity is thoroughly explained in both a teacher’s guide and a student lab sheet. Science...
Chymist
Plop, Plop, Fizz, Fizz
One of the most recognizable commercial melodies was written in 1977, and led to gastronomical relief around the world. Scholars use Alka Seltzer tablets to measure reactants and calculate the chemical equation for the reaction of NaHCO3...
Inside Mathematics
Quadratic (2009)
Functions require an input in order to get an output, which explains why the answer always has at least two parts. After only three multi-part questions, the teacher can analyze pupils' strengths and weaknesses when it comes to...
EngageNY
Using a Curve to Model a Data Distribution
Show scholars the importance of recognizing a normal curve within a set of data. Learners analyze normal curves and calculate mean and standard deviation.
Inside Mathematics
Coffee
There are many ways to correlate coffee to life, but in this case a learning exercise looks at the price of two different sizes of coffee. It requires interpreting a graph with two unknown variables, in this case the price, and...
Inside Mathematics
Snakes
Get a line on the snakes. The assessment task requires the class to determine the species of unknown snakes based upon collected data. Individuals analyze two scatter plots and determine the most likely species for five...
Curated OER
Measure Mania
Groups of learners rotate through five classroom stations to estimate, measure, and record volume, length, weight, mass, and area using both customary and metric measure. They evaluate their data to determine how close their estimates...
Curated OER
Chemistry 231, Exam 3
This exam is aimed at assessing college level organic chemists. Ten problems are to be solved and include drawing molecular structures, assessing degrees of saturation, ordering alkenes according to stability, and explaining chemical...
Curated OER
How do Hypotonic, Hypertonic, and Isotonic Solutions Affect the Water Movement of a Cell?
After removing the shell from a raw egg, cell biologists soak the egg in either a hypotonic, hypertonic, or isotonic corn syrup solution. They calculate the percent change in mass and compare it to the strength of the solution in a...
Illustrative Mathematics
Giantburgers
What is a million between friends? This fast food chain claims to serves a certain percentage of Americans every day. The resource agrees, but depending on how you calculate it, you could be a million off. Let your fast food munchers be...
EngageNY
Estimating a Population Proportion
Find the percent of middle schoolers who want the ability to freeze time. The 21st installment in a series of 25 has groups collect a random sample of respondents who answer a question about superpowers. Using sample statistics,...
Statistics Education Web
Walk the Line
How confident are you? Explore the meaning of a confidence interval using class collected data. Learners analyze data and follow the steps to determine a 95 percent confidence interval. They then interpret the meaning of the confidence...
Southwestern Medical Center
Field Epidemiology: Investigation of an Unknown Disease
More than 90 percent of the people in a building have come down with an illness, and it is your job to investigate. Teachers give scientists the data needed to decide what is important and how they can solve the mystery....
Virginia Department of Education
Laboratory Safety and Skills
Avoiding lab safety rules will not give you super powers. The lesson opens with a demonstration of not following safety rules. Then, young chemists practice their lab safety while finding the mass of each item in a mixture and trying to...
Curated OER
Candy Machine
Using the concept of a candy vending machine, young mathematicians explore the sugar ratios found in different types of candy. Using the provided information, class members calculate and compare different ratios in...
Curated OER
Parting Ways
Students become part of the solution as they practice figuring percents. The number of men versus women present in the room and their heights can be used to form the basis of this investigation.
Curated OER
Chemical Stoichiometry Problems
In this stoichiometry worksheet, students calculate theoretical yield and percent yield. This worksheet has 2 problems to solve.
Curated OER
Topics in Math
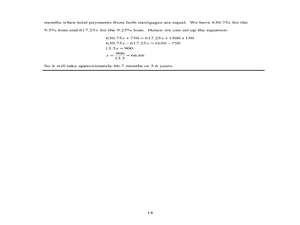
In this consumer mathematics worksheet, students explore a variety of topics in mathematics including simple interest, perimeter, area, volume, translating words into symbols, percentage problems and mortgage calculations. The fourteen...
Curated OER
The Literature Connection
Second graders read Cucumber Soup by Vickie Leigh. They make representations for the number of each kind of bug found in the book. This lesson is a terrific way to show students how fractions, decimals and percents are related.
Curated OER
Mixing Colours
Young scholars explore ratios and their relationships to fractions. They explain the process of identifying ratios and describe their comparison. Students write ratios as fractions and by using colons. They convert the ratios to...


